At Springboard, we pair learners with industry experts who help them learn data science. We help take learners all the way to a working portfolio project. This is a final project from one of our learners, Robert Chen.
Introduction
My name is Robert Chen. I am an engineer from the embedded software industry that took Springboard’s Introduction Data Science course. For my capstone project I used R to analyze Yelp’s data to see if there were ways the rating system could be tweaked to make it easier to pick good Indian restaurants. I had a lot of fun learning about how flexible and easy R is to use, the thought process data scientists go through (with the help of my fantastic mentor, Andi), and a few interesting things about Indian restaurant reviews.
First, a little bit about myself. I’m fairly comfortable programming and using math. However, I didn’t have any knowledge of data science and statistics was more of an afterthought in my university training. The feedback I got from data scientists on what I needed to work on to enter a data science career was (1) A strong understanding of segmentation, clustering, and regression, and (2) I needed to show what I could do through a capstone project. This is why when I was exploring various online methods of learning Data Science, I about fell out of my chair when I saw Springboard’s curriculum — it had curated courses in segmentation, clustering, and regression (among other things), and it offered the opportunity to do a capstone project under the guidance of a data scientist from an established company. It was the perfect fit!
My experience with Springboard was very good. I saved a lot of time using the curated curriculum rather than researching every resource and picking and choosing them. I especially liked the courses on data exploration that featured data scientists from Facebook describing how they explore data and the courses on modeling which featured fantastic and fascinating courses from MIT on famous modeling examples (my favorite being the “Moneyball” and “Can we predict Supreme Court cases” examples).
It then came time to choose the capstone project. Under the guidance of Andi, we decided to use the Yelp dataset (you can view a list of public data sets here). I was curious if we could use the exploration techniques I learned to solve a problem I had encountered in one of my favorite apps.
The Problem — So Many Choices!
Whether on a vacation with the family or on a business trip — or simply at home wanting to try something new, Yelp has been a great way to find good restaurants. One problem I encounter sometimes is that there can be a lot of restaurants of the same cuisine with similar ratings. Looking at Indian restaurants in the Schaumburg area, for example, one gets the following results:
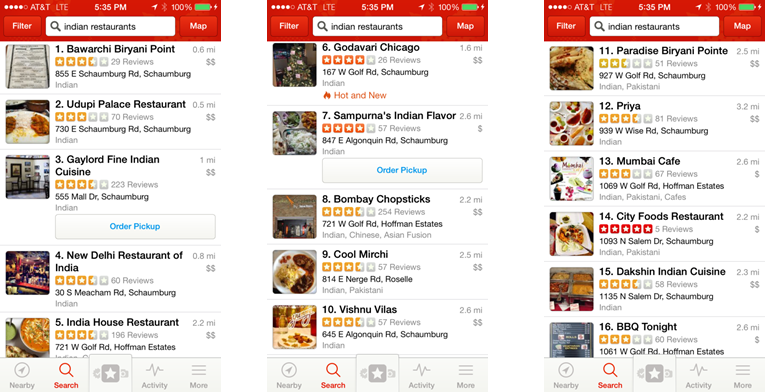
One can see one restaurant with a 5 star rating (which only has 5 reviews), and another with a 2.5 rating. The remaining 14 all have a rating between 3 and 4 stars. With so many restaurants having similar ratings, it can be challenging to figure out which place to try. Is there a way to “cut through the noise” and extract more information so that a clearer choice emerges?
Solution 1 – Give More Weight to Frequent Reviewers
For my project I experimented with 2 ways of tweaking Yelp’s rating system to see if it could help make it more selective. The first was to give more weight to those who had reviewed more Indian restaurants — if they had reviewed 2 different Indian restaurants, for example, their rating was given a 2x weight. 3 different restaurants meant 3x etc.
The first step was to explore the dataset and see if there were enough reviewers of Indian restaurants who had done multiple restaurant reviews. The result was that 1,735 out of 9,549 reviewers of Indian restaurants had done two or more reviews (approximately 18%) — enough to justify going forward (interestingly, one real aficionado of Indian food had reviewed 93 different Indian restaurants!).
The next step was to see if this method could be generalized to other cuisines. Taking the top 10 ethnic cuisines in America according to Parade magazine, one can see with some R work that they all had at least 14% of reviewers who reviewed multiple restaurants of that cuisine:
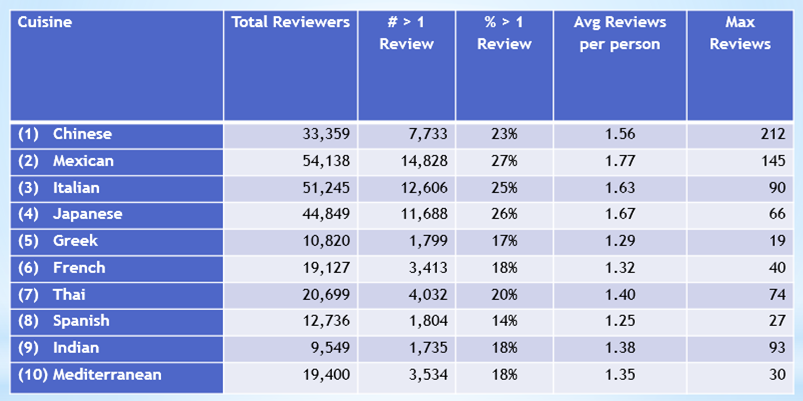
It’s also interesting to note that there is a real enthusiast for Chinese cuisine who reviewed 212 different restaurants!
The next step was to see what impact this new weight would have. This turned out to be really easy in R, using the “summarize” and “group_by” commands from dplyr. The net result was the weight would cause an average drop of 0.09 stars, with drops as much as 1.14 stars and increases as much as 0.77 stars.
The real question was what impact this would have on the user experience. As an experiment, I tried one city from the Yelp dataset — Tempe, Arizona. Here, there were 8 Indian restaurants with a 4 star rating. When applying the weight, several of those restaurants dropped to 3.5, some stayed at 4, and one rose to 4.5. A clear choice had emerged!
Although this worked well for Tempe, the next question was “how about other cities?”. After looking at 4 star Indian restaurants in all 14 cities in the Yelp challenge database, the results were as follows:
–Three only had one choice to begin with — no further tweaking needed.
–Five saw the number of choices reduced (for example, from seven restaurants to four).
–Six produced a clear choice (for example, from eight restaurants to just one).
One can see that, with this tweak, a clear choice emerged 55% of the time when there were alternatives.
Solution 2- Generate an “Authenticity” Rating
Encouraged, I went on to try a second method of tweaking Yelp’s rating system. This was to emulate the old (before Yelp) method of selecting Indian restaurants by walking by them and seeing how many Indian people were eating inside (good for areas with lots of Indian restaurants, such as Devon Avenue in Chicago). The closest way to approximate this was to create a separate rating in Yelp based on those reviewers who had Indian names.
The first step was to extract all of the Indian names. After analyzing all of the names of reviewers in the Yelp dataset and using sites such as www.indianchildnames.com, 608 names, ranging from Aayush to Yuvaraj, were found.
The next step was to extract all reviews of Indian restaurants with reviewers having those names. This turned out to be pretty simple using R’s “%in%” construct and “subset” command.
From there, generating the new “Indian name rating” was a simple matter of using the group_by and summarize commands in dplyr again.
The result was telling — in contrast to the -1.14 to 0.77 (mean -0.09) result of method 1, the result with this method was a range of -1.92 to 0.31 (mean -0.44) — the average effect was a drop of almost 0.5 stars for every restaurant — with some being dinged as much as 2 stars and increasing at most a little over 1/4 of a star. Those with Indian names were certainly harder to please when it came to Indian restaurants! A logical conclusion.
Now we can ask, “what does this mean for the user experience?” Taking the example of Tempe, Arizona, the result here too was a convergence to one restaurant — though how it got there was different — all but one restaurant dropped in rating (some by as much as 2 stars), with one restaurant retaining its 4 star rating.
When extended to other cities this led to what is perhaps the most interesting result of this study:
Of the 11 cities that had enough reviewers with Indian names to qualify (a threshold of 5 reviewers with Indian names was used), all 11 converged to a single choice!
This was really interesting. It was almost as if the Indian population of each city converged by word of mouth on a “chosen restaurant” for that city.
The thing going through my mind after learning this was “I would sure be interested in finding out what that restaurant is in a city.” 🙂 Yelp could present this information through an “Authenticity” badge, which could look something like this:

By clicking on the “A”, an explanation of the rating could appear. Alternately, a filter by “Authenticity rating” could also be offered.
Get To Know Other Data Science Students

George Mendoza
Lead Solutions Manager at Hypergiant

Leoman Momoh
Senior Data Engineer at Enterprise Products

Sunil Ayyappan
Senior Technical Program Manager (AI) at LinkedIn
Putting it All Together
One thing that my mentor Andi helped me with was the “so what” aspect of this project — thinking about why the company should care about the results of the data. It would cost money, after all, to put something like this in place. Why would Yelp be interested in going to the trouble?
The main reasons that came to mind are that it improves Yelp’s main value proposition and could also be a source of additional revenue.
Yelp’s #1 value proposition to users is its accurate “crowdsourced” ratings — when one visits a 4-star restaurant, one wants as much assurance as possible that they’ll get a true 4-star experience. Since people of a certain ethnicity are more used to eating their cuisine, through experience alone they should be better able to distinguish quality, thus providing a more accurate rating (admittedly tastes can vary between ethnicities, which is why “Authenticity” would be an additional badge and not a fundamental change in Yelp’s base rating).
The Authenticity Rating could help provide additional revenue. By knowing who is interested in Authenticity (gauged by who uses the filter or who ultimately chooses the “chosen” restaurant), Yelp could target that audience for selected ads that they may have interest in (discount flights to India, for example, or Indian cookware, or literature on India). This could also be extended to strengthen Yelp’s Daily Deal program. Finally, this rating system could potentially increase engagement among ethnic populations if they find out their rating could have more impact.
Another thing Andi encouraged me to think about thoroughly is what potential next steps would be. It would be interesting to explore improving the Authenticity rating by using other parts of the Yelp database — such as using modeling to extract an authenticity rating from the text of the reviews, or giving more weight to those reviewers who have also reviewed Indian grocery stores, or dinging the rating a bit for those restaurants that have been given the Yelp attribute “touristy.”
What would be most interesting would be to see if the same convergence to one “chosen restaurant” applies to other ethnicities — such as those with Chinese or Vietnamese names. One day I would love to be able to use the rating to be able to make an informed choice in areas with a high density of ethnic restaurants — such as Chinese restaurants in the Bay Area, or pho restaurants in the San Diego area.
In summary, using R and the principles learned in class, I learned that the two techniques I used (giving more weight to multiple reviewers and assigning an “authenticity” rating that uses the reviewer names of a certain ethnicity) could be used in Yelp to simplify choosing which restaurant to go to — with the “authenticity rating” producing especially interesting results. I also learned how easy it is to use R to quickly explore and see the result of tweaks in large sets of data such as the Yelp dataset.
I very much enjoyed working on the project and getting a taste of the fascinating questions data science can help answer, and very much enjoyed my experience with Springboard.
Thank you for taking the time to read this article. If you have any comments or suggestions I would love to hear them. Until then, Bon Appetit!
Capstone projects are extremely beneficial to newcomers in the field of data science. It sharpens their skills and allows them to experience what it’s like to work as a professional data scientist.

Bio: Robert is a graduate of Stanford University and a National Science Foundation Graduate Fellow whose high-tech journey has included stints at Motorola, Sasken Communications, and embedded video startups ingenient technologies and Z3 Technology. He is a new enthusiast of Data Science and a long-time enthusiast of good Indian food. Robert is currently a Software Engineering Manager at Cengage Learning, where he is working on software to help teach developmental mathematics to entering community college students.
Robert’s LinkedIn profile is www.linkedin.com/in/rchen314 and his Twitter profile is @rchen314.
Github link for code: https://github.com/rchen314/SpringboardCapstone_YelpAnalysis
PDF of paper: http://tinyurl.com/h7rmafb
Presentation Slides: http://tinyurl.com/jp4ze9k
YouTube Presentation: https://www.youtube.com/watch?v=uH5SC3WcfMM
Since you’re here…Are you interested in this career track? Investigate with our free guide to what a data professional actually does. When you’re ready to build a CV that will make hiring managers melt, join our Data Science Bootcamp which will help you land a job or your tuition back!