![65 Excel Interview Questions for Data Analyst [2022 Prep Guide]](https://www.springboard.com/blog/wp-content/uploads/2022/06/interview-questions-for-data-analyst-.png)
Free Data Analytics Course
Jumpstart your journey with 25 essential learning units in data analytics. No cost, just knowledge.
Interviewing for a role as a data analyst is a skill that requires both experience and practice. It is by no means a given that all good data analysts will give good interviews. Explaining data succinctly is part of the job, but explaining the software and tools that data analysts use definitely isn’t, and not everyone is naturally gifted in this area. This means that answering Excel interview questions one after another can be pretty difficult.
To simplify the whole process, we’ve put together an extensive list of basic, intermediate, and advanced Excel interview questions and answers for data analysts that is sure to leave you feeling confident and ready to score your dream job.
General Excel Interview Questions & Answers
Before interviewers get into technical questions, they’ll often ask some more personal questions about you, your background, and your history and thoughts on Microsoft Excel.

Become a Data Analyst. Land a Job or Your Money Back.
Transform real-world datasets into actionable recommendations. Master technical and strategic thinking skills and frameworks. Land a job — or your money back.
Introduce Yourself.
Always remember that you’re starting from zero when you attend an interview. While the interviewers may have looked over your resume, it will have been but one of many, and it will not have given many insights into you as a person. Conveying your personality and work attitude is very important because interviews are no longer purely technical—determining whether a candidate is also a good fit for their company culture.
Although a lot of companies will prepare specific “culture-fit” interview questions, it’s always good to get a head-start in showing them what a great fit you’d be right from your introduction.
Consider covering points such as:
- Your background and hardworking nature
- Your ability to work well within a team
- Your respect for your colleagues and their opinions
- Your passion for solutions that satisfy all involved
- Your belief in the importance of respectful communication
- Your flexibility and ability to compromise
What Do You Know About Excel?
One way to answer this question is to give an overview of what you know about Excel from your past experiences with it. This can cover a wide range of information, ranging from both basic and advanced examples of what it can be used for, to comments on its long-standing and continuing relevance within the industry. Make it clear that you know Excel in and out, but you can save covering specific tasks for when the interviewer asks you about them.
What Is the Importance of Excel in Data Analysis?
For this question, it’s important to show that you understand the practical uses of Excel and how they are employed by analysts and companies. You can cover its versatility by describing two of the most niche and contrasting projects you’ve used Excel for in the past.
A data analyst’s job is to collect, analyze and organize data so that it can be easily viewed, comprehended, and utilized by a company. This means that ensuring your findings are understandable to non-data analysts is one of the most important parts of the job, and makes Excel one of its most valuable tools.
If you’re drawing a blank, just remind yourself of what a data analyst does, and you’ll soon realize just how much the job relies on Excel.
What Is the Most Challenging Project You’ve Encountered on Your Learning Journey?
A good answer for this question is a project that deviated from the “typical” Excel use-cases you originally studied. This might be the first project you encountered that required creative thinking and custom solutions in order to achieve its goal. Your ability to manipulate the software to your needs in such a situation will show your mastery of Excel fundamentals and your problem-solving skills, as well as a good work attitude.
A Situational Question Based on Your Resume

Interviewers will often ask a couple of questions based specifically on your resume. All interviewers are different, and all companies have certain interview guidelines to follow, but there are still common types of questions that you’re likely to get asked.
For example, it’s common for an interviewer to ask questions based on a skill or area of expertise listed on your resume that does not have anything obvious to back it up. Even if you have put together an awesome data analyst resume, not every skill can have a qualification or example of direct experience to go along with it. In cases like this, interviewers may want to know more about these skills and how you acquired them.
You might also be asked about the personal attributes you have included on your resume. A common example of this might be the interviewer commenting that you consider yourself to be a team player, and requesting a concrete example of this from your previous jobs.
Basic Excel Interview Questions for Data Analysts
In this section, we’ll cover a handful of basic Excel interview questions for data analysts, but even intermediate and advanced candidates should be prepared for the possibility of meeting a few of these questions. The fundamentals never lose their importance and your attitude towards them is something interviewers will take note of, so make sure to refresh your knowledge on the basics of what data analytics is, and the role Microsoft Excel plays in the industry.
What Is Microsoft Excel?
Microsoft Excel is a spreadsheet software capable of organizing raw data into a readable format and manipulating it by performing calculations and simple computations.
What Are Cells?
Cells are crosspoints of the rows and columns within a spreadsheet and are referenced by first the column letter and then the row number (i.e. A1). Cells store all information inputted into a spreadsheet, and this information is referred to as “cell content.” Cell content encompasses multiple types of information such as a numeric value, a row or column title, notes, formulas, or functions.
Explain the Spreadsheet and Its Fundamentals.
A spreadsheet in Microsoft Excel is made up of cells organized into rows and columns. Information is inputted into the cells in order to organize, display and manipulate data. For instance, a spreadsheet can contain the names of a list of products, the price per unit, and the number of units sold.
The viewer would then be able to read and search through this list. They would also be able to instruct Excel to perform a calculation, taking into account the price per unit and how many were sold, detailing how much money was made from each product.
Get To Know Other Data Analytics Students

Joel Antolijao
Data Analyst at FanDuel

Bart Teeuwen
Global Business Analyst, Global Talent Intelligence (GTI) at Meta

Cana Curtis
Research Analyst at Virginia Commonwealth University
How Many Excel Data Formats Are Available? Name Them.
Six. They include:
- Excel workbook: .xlsx
- Excel macro-enabled workbook: .xlsm
- Excel binary workbook: .xlsb
- Template: .xltx
- Template (code): .xltm
- XML data: .xml
What’s in Excel for a Cell Address?
A cell address (or cell reference) is made up of the row letter and column number a cell is located in. The cell in row D, column 7 has the cell address of D7. Cell addresses are used in formulas when giving the spreadsheet instructions but are also used in general communication to specify cells.
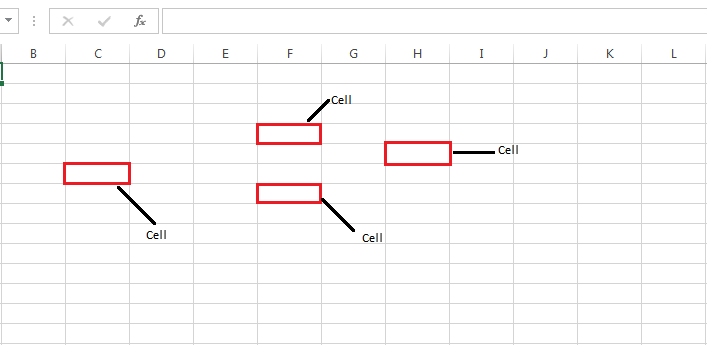
Can You Add Annotations in a Cell?
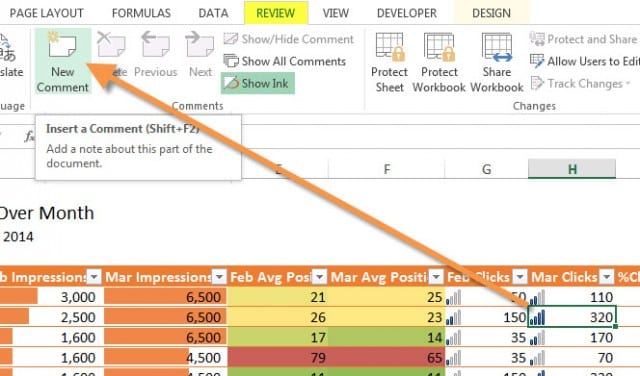
Yes, there are various annotating techniques available in Excel such as utilizing colors, callouts, and cell comments. Cell comments are directly linked to specific cells and are indicated by a red triangle in the corner of a cell. To see the comment, simply hover over the cell with your mouse.
What Is the Shortcut to the Microsoft Excel 2013 Data Filter?
The shortcut to turn filters on or off is Ctrl+Shift+L. To display the filter drop-down menu, the shortcut is Alt+Down Arrow.
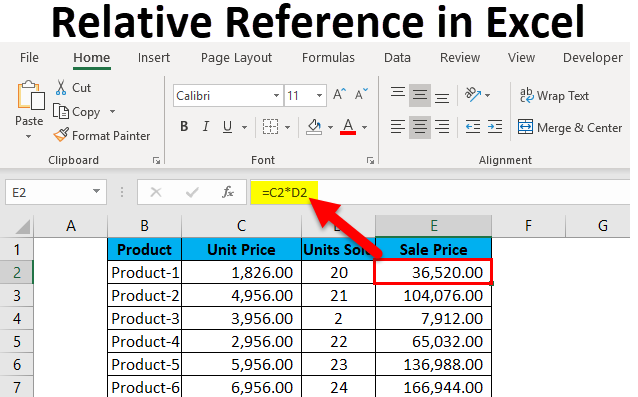
What Is Relative Cell Referencing in Excel?
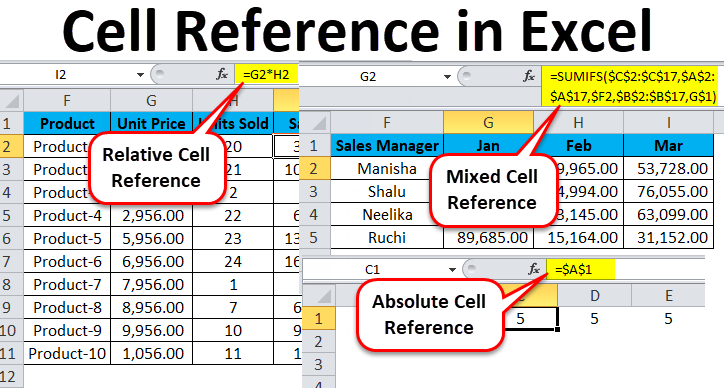
Relative cell referencing is used when dealing with formulas in Excel. If you write a sum formula to add the values of a set of cells (e.g A4 to A8) together, it will look like this: =SUM(A4:A8).
If you use relative cell references, then when you copy this formula to a different section of the spreadsheet, the cells will change relative to where the formula has been pasted. For example, if you copy the formula across one column, the formula will become =SUM(B4:B8).
What Is Absolute Cell Reference in Excel?
Absolute cell referencing is the exact opposite of relative cell referencing. By marking the row number and column letter with a $ symbol, you can make a cell reference fixed (or “absolute”).
This means that when you copy and paste it to another cell or use AutoFill, the cell references will not change. The formula =SUM(A4:A8) will stay as =SUM(A4:A8) no matter where you put it.
How Is a Cell Formatted?
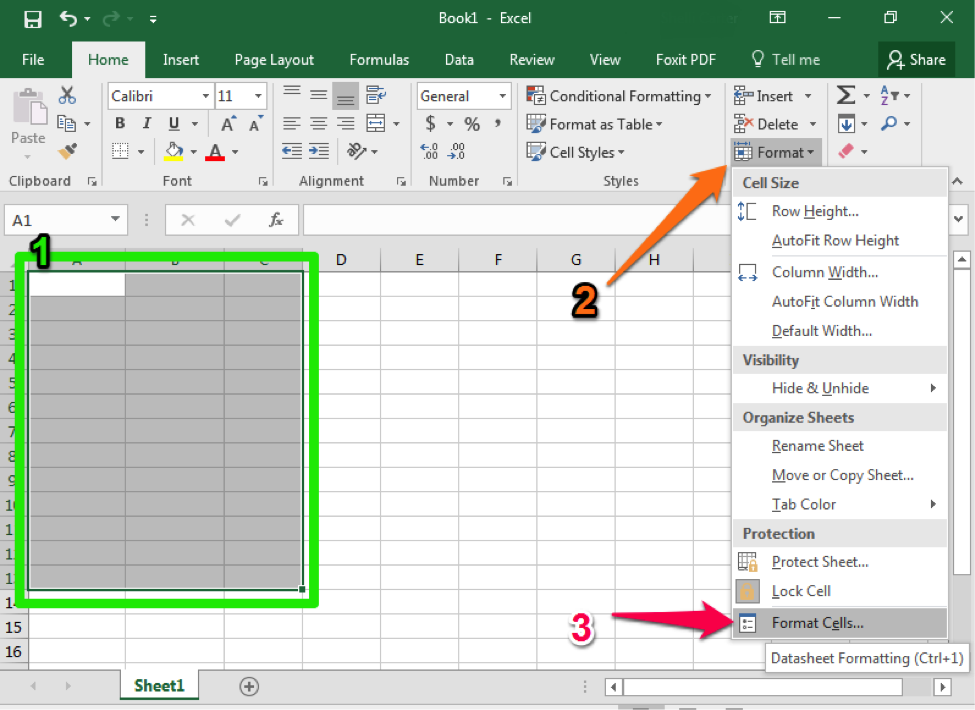
The default font of all cell content in a workbook is Calibri (in black). However, you can change this by selecting any cell and clicking the Font drop-down menu on the Home tab. You can change the font, size, and color and make your text bold, italic, or underlined. Other formatting options include:
- Fill colors
- Borders
- Cell styles
- Auto number formatting (adding currency symbols, percentage symbols, etc)
- Alignment
- Auto text formatting (changing the appearance of dates and times etc)
- Protection features: ‘Locked’ (cells cannot be edited) and ‘Hidden’ (formulas are not displayed) which can be used on a protected workbook.
How Many Cell Formats Are Open?
Microsoft Excel 2003 can handle 4000 different cell format combinations, and Excel 2007 and later can handle 64,000. Any unique combination of formats counts towards this number: for example, one cell formatted with Arial font and pink fill color, and another cell with Arial font and blue fill color would count as two different combinations.
These combinations can pile up quite quickly and it can be surprisingly easy to reach the maximum number, especially in Excel 2003. When this happens, you’ll receive a ‘Too many different cell formats’ error message, and you’ll need to stop adding new combinations.
Can You Wrap a Text Within a Cell in Excel? If Yes, Then How?
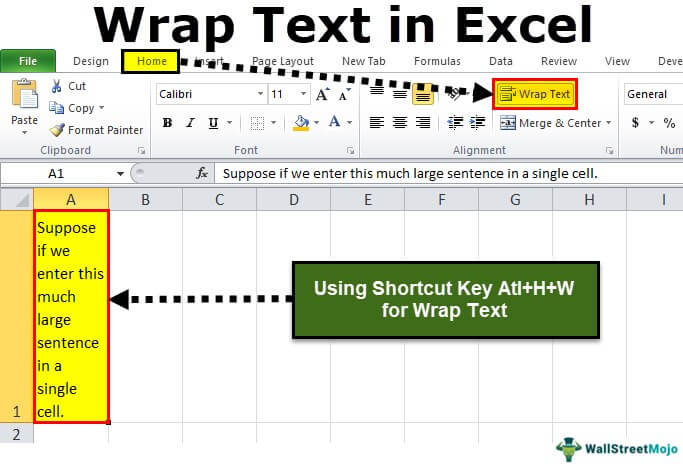
Yes. Text can be wrapped within a cell by selecting a cell and clicking the “Wrap Text” button in the alignment group on the Home tab.
On a desktop, text wrap can also be achieved by selecting the desired cell and pressing Alt+H+W. The text will wrap according to the width of the column and will adjust accordingly if the column width is changed.
Is There a Way To Secure Your Excel Workbook?
Excel files can be password protected to secure the data within them. To do this, click the “Protect Workbook” box and select “Encrypt with Password.”
A password of any length or style can then be entered to protect your workbook. Once a file is password protected, further security can be added by using the “Locked” and “Hidden” features to disable the editing of cells and hide formulas.
Excel Function vs. Formula: What Is the Difference?
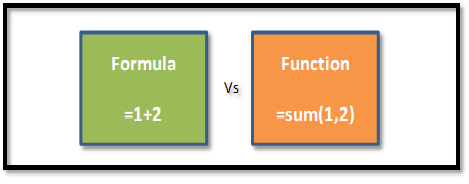
A formula is a written instruction for a calculation in Excel. All calculations within a spreadsheet will be written as formulas (e.g =C3+C4+C5+C7+C8).
Functions are prewritten formulas and a feature of Excel. The software has over 500 built-in functions that allow users to achieve complicated calculations without having to create the formula themselves or type it out in full.
One of the simplest functions is SUM, which allows a user to indicate a range of cells they wish to add together, rather than typing them all out one by one like the example above. When using the SUM function, the formula would look like this: =SUM(C3:C8). When you use a function, the end product is still referred to as a formula, it’s just a formula that contains a function.
What Does the Red Triangle in the Cell’s Upper Right Corner Indicate?
A red triangle in the upper right corner of a cell indicates that a cell comment has been attached to this cell. If you hover over the cell with your cursor, the comment will be displayed.
Intermediate Excel Interview Questions for Data Analysts
As you interview for more senior positions, you’ll likely encounter questions that describe a situation and a goal, and you will be expected to figure out and accurately describe a way to reach that goal. Often, you’re free to choose your own methods when solving a hypothetical problem posed to you by the interviewers, but you need to be ready to state the reasons for and benefits of the methods you chose.
Define Excel Charts.
A chart in Excel is a feature that allows you to display data through a range of visually intuitive graphs. These charts and graphs can make it easier and quicker to comprehend data compared to just looking at the numbers on the worksheet. Available charts on Excel include:
- Bar graphs
- Line graphs
- Pie charts
- Area graph
- Scatter graphs
- Surface graphs
- Doughnut graphs
- Radar charts
What Is a Macro in Excel?
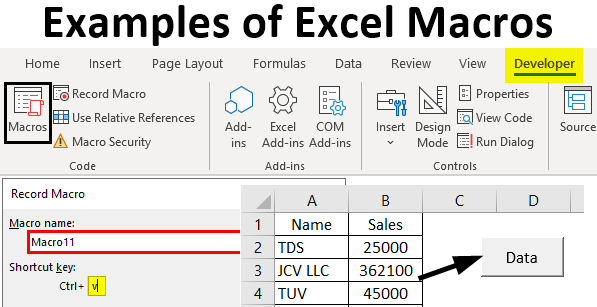
A macro is a sequence of performable actions in Excel that have been recorded, saved, and named for easy use in the future.
A macro can then be called on whenever necessary to complete the sequence of actions without the user having to type each step manually. This saves valuable time and effort when performing repetitive tasks with larger sets of data.
How Do You Apply a Single Format to All the Sheets in a Workbook?
Formatting will automatically be copied to all selected sheets, so to apply a single format to all the sheets in a workbook, simply hold down Ctrl (or Cmd on Mac) to select every sheet. Only formatting edits will be copied over, not data.
What Is a Cell Relative Address?
A relative cell address (or relative cell reference) is a cell address within a formula that does not include a $ symbol before the row number or column letter.
This means that when the formula is copied one column over, the cell addresses will change accordingly. The formula will calculate relative to its position, rather than displaying the calculation from the original position.
Explain the Order of Operations Used in Excel.
Excel’s order of operations roughly follows the acronym PEMDAS (parentheses, exponents, multiplication, division, addition, subtraction).
- () | Parentheses
- : , | Reference operators
- – | Negation
- % | Percent
- ^ | Exponentiation
- * / | Multiplication and Division
- + – | Addition and Subtraction
- & | Concatenation
- ><= | Logical comparisons
What Is an Excel Drop-Down List?
A drop-down list allows the creator of a spreadsheet to control the data inputted into certain cells. In other words, when the creator only wants one of four predetermined options to be used, instead of relying on users to adhere to this, they can ensure it is adhered to by having the users click an option from a drop-down list instead of manually typing it.
What Are the Perks of Using the Excel SHEET Formula?
When working on a workbook with lots of data and multiple sheets, the SHEET function can help the user search for particular segments of data. When a cell reference, named range, or Excel Table is entered as the value, the SHEET function will return the index number of the sheet that contains this value.
Excel includes hidden sheets in its numbering sequence. If a table named ‘Profits1’ is on the tenth sheet, the SHEET function will return 10. The formula will look like this: =SHEET(Profits1).
Running the SHEET function without a value will return the index number of the current sheet (i.e the sheet in which the formula is written). There is also a similarly named function SHEETS—this function returns the number of sheets in a workbook.
How Do You Use the Name Box Function?
The Name Box is an input box above the Excel sheet, to the left of the formula bar. It’s default mode displays the address of the currently selected cell, but it has other uses too.
Firstly, the Name Box can be used to quickly select a specific cell or range of cells: typing in a cell reference like G8 will automatically select the cell G8, and typing in a range of cells like G8:G30 will select all cells within that range.
Secondly, the Name Box can be used to create a named range and then used as a drop-down menu to navigate between named ranges.
If You Don’t Want To Change the Cell Addresses As They Are Copied, What Do You Do?
To make sure cell addresses do not change relative to where they are copied, add a $ before both the row number and column letter to create an absolute reference (e.g $A$5).
An absolute reference will not change under any circumstances, so it can be copied anyway and stay exactly the same. You can use this feature if, for example, you want to display the outcome of a calculation in multiple places, like gathering the end profits for each month in their own separate table.
Can You Write the Formula for the Following Statement: Multiply by 10 the Value in Cell A1, Add 5 to the Result, and Then Divide by 2?
This answer is: =(A1*10+5)/2
The contents of parentheses are always dealt with first, and multiplication is always dealt with before addition, meaning the formula will first multiply A1 by 10, then add 5, and finally divide by 2.
Is It Possible To Use Multiple Data Sources To Render PivotTables?
Yes, data can be imported from a variety of sources by accessing the Data tab and clicking Get External Data > From Other Sources. Excel worksheet data, data feeds, text files, and other such data formats can be imported, but you’ll need to create relationships between the imported tables and those in your worksheet before using them to create a pivot table.
How Do You Build Named Ranges?
Building named ranges can make formulas both quicker and more intuitive to write. For instance, instead of manually inputting the cell references of a given column (i.e. A1:A50), you can instead give that entire range of cells a contextually appropriate name (i.e. Profits).
So instead of =SUM(A1:A50), you can write =SUM(PROFITS). A named range is most often named for the heading of a certain column or row of data. Creating a named range can be done in three different ways. The first is simply using the Name Box.
Select the range of data you wish to name, and type the name into the Name Box to complete the process. A named range created in this way will apply to the whole workbook.
To designate a specific worksheet, you must instead use the Define Name method. Again, select the range of data you intend to name, and this time go to the Formulas tab and click Define Name. This will bring up a dialogue box in which you can name your range and specify a scope (the entire workbook or a particular worksheet).
The third option is most suited to creating multiple named ranges at once and creating the names from column and row headers. First, select all of the data you wish to create names for, as well as all of their headers.
You then need to open a dialogue box by going to the Formulas tab and clicking Create from Selection. You will then be able to indicate which rows or columns contain the intended names (i.e. the top row). When you click OK, ranged names will be created for all the selected data simultaneously.
How Do You Hyperlink in Excel?
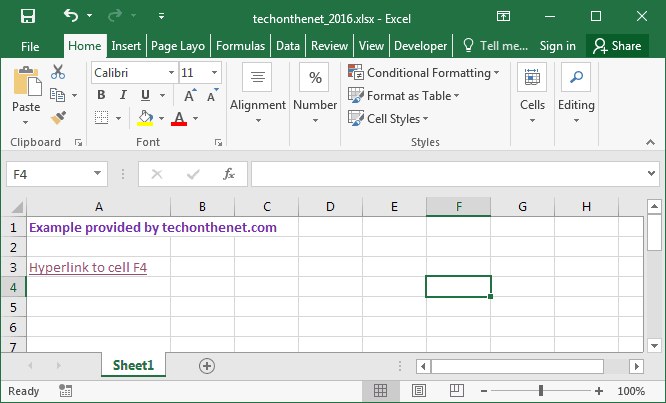
To create a link in Excel, select the element you wish to use as the anchor (this can be a cell or an object like a picture). You can then either select Link from the Insert tab, right-click and select Link on the menu, or press Ctrl+K.
This will bring up a variety of options that will allow you to indicate what kind of content you would like to link to, such as a file, a web page, a specific location, or an email address.
Advanced Excel Interview Questions for Data Analysts
This last section covers advanced Excel interview questions you may encounter while interviewing for a more senior position. Advanced questions may often cover the finer details of a feature and its available customizations, as familiarity with these points would not be expected from less experienced candidates.
What Is VLOOKUP?
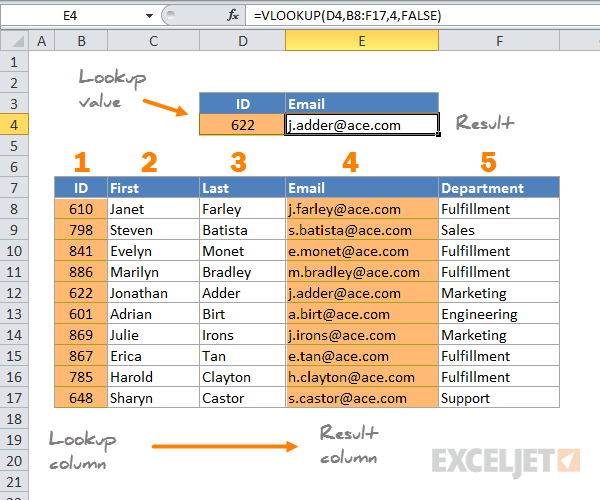
VLOOKUP is a predetermined function in Excel that allows the user to find data within a table corresponding to a particular row.
For instance, say you have a table of employee information that includes (from column A onward) employee ID, employee name, start date, hours per week, and salary. With VLOOKUP you can specify a row from the first column (i.e an employee number) and look up corresponding data from other columns, like the salary of the employee with that employee ID.
How Do You Use VLOOKUP?
The VLOOKUP syntax is composed of the lookup value, the range of data in which the lookup value is located, and the column number within this range that contains the desired return value. You can also specify whether you want an approximate match or an exact match to be returned, but this step is optional.
In other words, you must first indicate the cell reference of the value you would like to search for. Next, indicate the range of data you would like to search for (this will often be the entire table). You can then specify the column that contains the information you seek and input it as a number (the right-most column selected will be column 1).
To indicate whether the return value should be approximate or exact, finish the formula with TRUE (for approximate) or FALSE (for exact). An example formula would look like this: =VLOOKUP(A7,A1:E10,5,FALSE).
What Is the Default Value of the Last Parameter of VLOOKUP?
If the last parameter is not specified via TRUE or FALSE, the return value will default to TRUE (approximate), and show an approximate match for your request.
What Is the Main Limitation of the VLOOKUP Function?
The VLOOKUP function can only move in one direction, from left to right. Therefore, the information you wish to seek out must be located in a column to the right of the lookup value’s location.
In newer versions of Excel, a successor to VLOOKUP has been added, called XLOOKUP. This new function works in any direction and defaults to exact matches rather than approximate. At some point in the future, XLOOKUP will completely replace VLOOKUP, but this will not happen until the majority of users have moved away from using older versions of Excel.
Does VLOOKUP Look Up Case-Sensitive Values?
VLOOKUP is not case-sensitive, and will always return the first value of the match irrespective of the case. In other words, the name Apgar and the acronym APGAR would be viewed as the same by VLOOKUP.
It is, however, possible to manipulate VLOOKUP into returning case-sensitive values by using a helper column.
What Is a PivotTable in Excel?
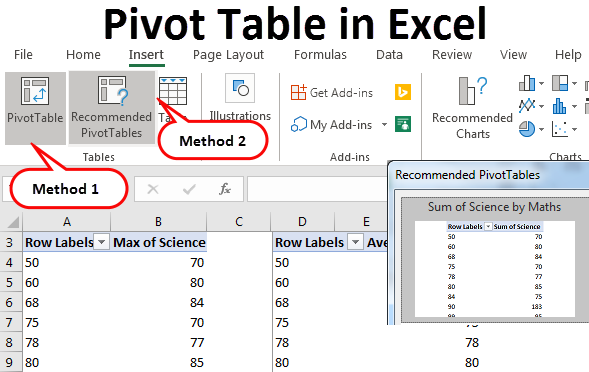
Using a PivotTable brings together information from different locations in a workbook and displays it in a separate table. It can be used to highlight or easily compare data from different angles without the need to manually create extra tables.
For example, if a workbook contains ten tables covering the population statistics (overall population, men, women, over 75, under 5, etc) of twenty different countries, a pivot table could bring together the population of men in all twenty countries in a separate table for comparison.
You could also easily edit it to next show the overall population of all twenty countries, and so on. This feature is especially useful when presenting data findings, as the data can be viewed and analyzed in a dynamic way.
How Do You Refresh a PivotTable?
To refresh a pivot table you can:
- Click the pivot table, select Analyze, and then select Refresh from the pivot table tools menu.
- Right-click the pivot table and select Refresh.
- Use the keyboard shortcut Alt+F5.
You can also refresh all pivot tables within a workbook at once by selecting the arrow underneath the Refresh button in the pivot table tools menu, and select Refresh All.
What Is a Dashboard in Excel?
Dashboards are a feature of Excel used to simplify and condense the presentation of data. Their purpose is to display large amounts of data on one page in a format that is easy to view and comprehend, so multiple factors can be quickly considered during the decision-making process.
Dashboards achieve this by making use of various charts, graphs, gauges, and figures that display data in an intuitive way to facilitate the thorough analysis of large sets of data.
As an example, a dashboard could use a variety of charts and graphs to display the overall sales, money spent per sale, type of customer, and most popular product for a department store. Having all of this information in one place would allow the store executives to easily correlate the data and pick the most opportune times to run limited sales on certain items.
What Are Macro Languages in Excel?
Macros for Excel are written in VBA (Visual Basic for Applications). You can use VBA to manually type out actions for a macro yourself, or you can “record” actions using the Macro Recorder in Excel, and the software will convert these to VBA code for you.
What Is the Most Common Error Message in Excel?
The most common error message in Excel is the #### error message, which is displayed when a cell is not large enough to display all the data that has been inputted into it. To solve this error message, simply drag the cell to increase its width or depth.
What Are the Different Sections of a PivotTable?
- Rows
- Columns
- Values
- Report Filter
What Are Two Ways To Extract Unique Values in Excel?
Excel can extract unique values by temporarily filtering out duplicates, or by permanently deleting duplicates.
The first can be achieved by selecting the desired range of data and navigating to Data > Sort & Filter > Advanced. To permanently delete duplicate values and create a list of unique values only, click Data > Data Tools > Remove Duplicates.
How Do You Find Duplicates in a Column?
To find but not delete duplicates in a column, select the target range of data and navigate to the Style group on the Home tab and click the arrow next to Conditional Formatting. You will then be able to choose Highlight Cell Rules, Duplicate Values, and enter the values you wish to find duplicates of. This will highlight duplicates of the values you entered.
How Do You Insert a Drop-Down?
To create a drop-down menu in Excel, simply select the cells you wish to contain the lists and click Data Validation in the Data tab. A dialogue box will appear where you can select the type of input these cells are ‘allowed’ to receive. Choose “List” and enter the options for your drop-down menu (separated by commas, no spaces) in the Source box.
How Do You Calculate the Sum Values Based on a Certain Condition?
To sum values that meet a single criterion, use the SUMIF function. To specify multiple criteria, you’ll need to use the SUMIFS function. To use this function, you’ll need to contrast a formula that specifies:
- The range of cells you want to sum.
- The range of cells you want to test against the first criteria.
- The first criteria.
- Additional ranges and criteria (up to 127 pairs).
How Do You Create Cross-Tabulation in Excel?
The product of the pivot table feature in Excel is often referred to in other software as a contingency table or cross-tabulation. To create a “crosstab,” use the PivotTable option on the Insert tab.
What Is an Excel Array Formula?

With an array, a user can perform multiple calculations on multiple items using just one formula. For instance, if you want to multiply A1 by B1, A2 by B2, A3 by B3, and so on, instead of writing a formula for each calculation, you can write =A1:A10*B1:B10 in cell C1, and the results for each calculation will spill down the C column.
This is called a multi-cell array, as the results will be stored in multiple cells. You can also create a single-cell array if, for example, you wanted to sum the entirety of the values calculated by the above array.
This would look like: =SUM(A1:A10*B1:B10) and return a single value calculated by adding the results of all ten multiplications together.
How Do You Extract the First Name From a Full Name?
There are two methods that can help extract the first name from a full name. The first involves using the FIND and LEFT functions. The FIND function can find the delimiter that separates the first name from the last name. This would most commonly be a space, but also be a comma or any other symbol.
The FIND function will return the numerical location of this target (with the first character of the text being 1). The LEFT function can then extract the number of characters specified by the FIND function from the beginning of the text (i.e the left).
However, the value returned by FIND will include the space itself, so we need to subtract 1 from the value in order to find the actual ending point of the first name. The formula would look like this:=LEFT(A1,FIND(“ ”,A1)-1).
The second method would separate the first names and last names and deposit them into separate new columns, using the Text to Columns feature found in the Data tab. The Text to Columns dialogue box will allow you to select the delimiter separating each field (e.g space) and show you a preview of the result. The last step will allow you to choose where you want the result to be displayed.
How Do the INDEX and MATCH Functions Work?
The MATCH function returns the position of a cell in a row or column based on its value and the INDEX function will return the value of a cell based on the cell reference.
How Do the INDEX and MATCH Functions Work Together?
You can use two MATCH functions within an INDEX formula to specify a cell reference and return the value of that cell. The dynamic formula will return the corresponding data of any two MATCH values you input.
For example, if you have a table detailing the price per unit and the number of units sold for a variety of products, you can use the match index function to return a specific piece of information about a specific product.
What Is Conditional Formatting? How Can It Be Used?
Conditional formatting will apply various formatting types onto cells based on specified conditions. For instance, it can be used to apply a highlight to any duplicate cells, or cells with a numeric value under 5.
What Is the Difference Between COUNT, COUNTA, COUNTBLANK, and COUNTIF in Excel?
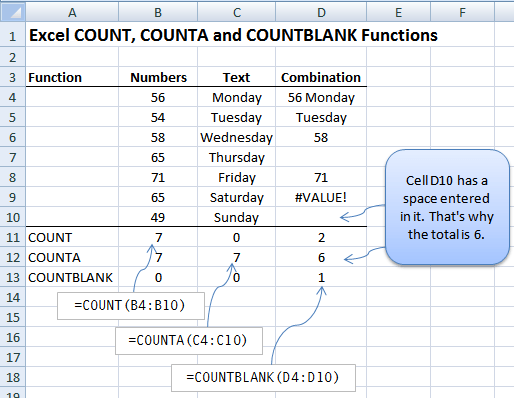
- COUNT: This function counts how many cells within a specified range contain numerical data. It will ignore (not count) any cells that are blank or contain text or symbols only.
- COUNTA: This function counts how many cells within a specified range contain data of any type. It will count all cells that are not blank.
- COUNTBLANK: This function will count the number of blank cells within the designated range.
- COUNTIF: This function will count only the cells whose value meets a certain condition specified by the user.
What Are the Questions You Would Consider Before Making a Chart and Dashboard?
A dashboard is used to see a range of data at a glance, to help correlate data and make informed decisions without having to manually find and re-find the data you need to compare and contrast. For this reason, a dashboard works best when created to answer a certain question or help make a certain decision.
Think about the decision you want to make and all the data that would play a part in informing that decision. If you were trying to settle on a type of fabric to make t-shirts out of, for example, and had many worksheets of data on the price, dye quality, allergens, strength, softness, resourcing, and emissions of different fabric types, making a dashboard with all this information would help you make an informed decision. You would be able to easily see which fabrics have a good result in every field, and pick the best for the job.
What Is the Ribbon in Excel?
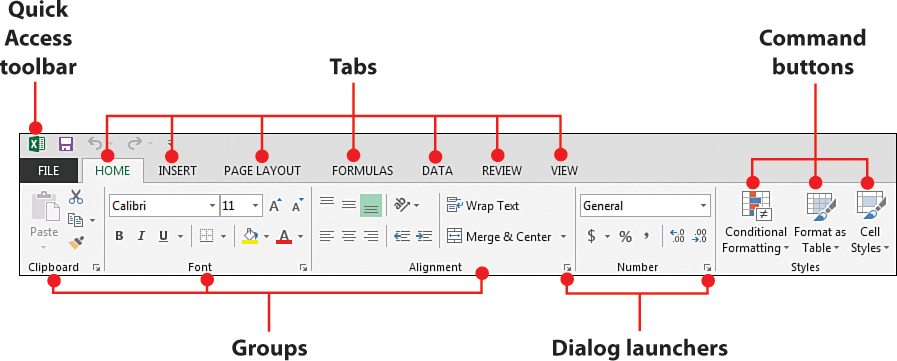
The ribbon refers to the set of menus near the top of the window which contains various tabs and features.
How Do You Clear Formatting in Excel Without Removing the Cell Content?
Select the cells from which you wish to remove all formatting and click the Home tab. From here, open the drop menu from the Clear button from the Editing section of the tab. Click Clear Formats. The keyboard command is Alt+E+A+F.
How Do You AutoFit Column Width in Excel?
Select the columns you wish to edit and click Format within the Cells section of the Home tab. Under Cell Size, select AutoFit Column Width. The will automatically fit the width of the cells to the contents of the cell.
What Are Freeze Panes in Excel?
Freeze Panes allow the user to lock certain rows or columns in place so they remain visible as the worksheet is navigated. For instance, for a table with hundreds of rows, the first row containing the headers can be frozen so it remains visible as the user scrolls down the table.
How Many Data Formats Are Available in Excel?
There are six data formats available in Excel:
- Excel workbook: .xlsx
- Excel macro-enabled workbook: .xlsm
- Excel binary workbook: .xlsb
- Template: .xltx
- Template (code): .xltm
- XML data: .xml
What Are the Two Types of Cell References in Excel?
Relative (changes based on position) and absolute (never changes).
What Is the Order of Operations in Excel?
The order of operations refers to the order in which Excel deals with the various elements of a formula. This order dictates the way formulas are written, as ignoring the order will result in your formula returning a completely different value.
- () | Parentheses
- : , | Reference operators
- – | Negation
- % | Percent
- ^ | Exponentiation
- * / | Multiplication and Division
- + – | Addition and Subtraction
- & | Concatenation
- ><= | Logical comparisons
What Is the Difference Between COUNT, COUNTA, COUNTBLANK, and COUNTIF?
All four of these functions count cells within a specified range. However, the criteria a cell needs to meet to be counted differs with each one. COUNT totals the number of cells that contain numerical values, COUNTA totals the number of cells that contain any kind of value, COUNTBLANK simply counts blank cells, and COUNTIF totals based on a condition specified by the user.
What Are Comments in Excel?
Comments are notes that are tied to a specific cell. When a comment has been added to a cell, it will be signaled by a red triangle in the top right corner of the cell, and the comment will be displayed when the cell is scrolled over.
Define a Chart in Excel.
A chart is a visual representation of data that is intuitive and easy to comprehend. They are used to highlight relationships, patterns, similarities, and differences between data points, rather than display the precise values.
How To Prepare for a Data Analyst Interview
It is always good practice to prepare for any interview and to do so as far in advance as possible to give yourself plenty of time to fill any gaps in your knowledge, CV, or portfolio. Here is a list of things you can check against to evaluate your level of preparedness:
- Does your portfolio include examples that demonstrate all of the skills and requirements listed in the job advert? If not, can more examples be added?
- Do you have examples of past experience you can talk about which demonstrate all of the skills and requirements listed in the job advert? Refresh your memory of any relevant experience that wasn’t recent. (If the job advertisement is lacking in details, research the skills employers expect data analysts to have.)
- Is your basic knowledge up to scratch or does it need refreshing? The more advanced your work becomes, the easier it can be to lose touch with the fundamentals! Checking a common data analyst interview questions list like this can help refresh your memory.
- Are there any functions or features you struggle to explain succinctly? If so, try to organize your thoughts by writing the explanations out and referencing examples on the internet.
- Work on your self-introduction if you lack confidence in this area.
- To land a data analyst job, one great tip is to prepare questions to ask the interviewer when prompted. Asking questions shows your interest in the job and indicates that you’ve put thought into the interview.
- If this is your first data analyst interview and you’re going for an entry-level role, you’ll need to make sure you’ve equipped yourself with all the skills and knowledge necessary to do the job. You may have already completed some kind of structured education that prepared you for this, but if not, a college course or an online data analytics bootcamp may be advantageous.
FAQs About Data Analyst Interview Questions
Here are a few commonly asked questions about advanced excel interview questions and answers for data analysts.
How Long Should You Prepare for a Data Analyst Interview?
The right amount of time to spend on preparation varies from person to person. The most important thing is to make sure you start preparing as soon as the interview is set. That way, if you discover some new data analysis projects you’d like to add to your portfolio or find an area you’d like to know more about, you’ll have plenty of time to do so.
If preparation goes smoothly and you finish covering everything many days before the interview, you can simply spend a few minutes reviewing everything again closer to the date.
Are Excel Interview Questions for Data Analysts Hard?
Excel interview questions are not designed to catch candidates out or simply find out whether they “know the correct answer” to something or not. They are instead used in tandem with portfolios and past experiences to gauge a candidate’s experience with and proficiency in the software.
As such, these questions are not “hard” per se, but they are often quite technical. If you are familiar with the software and take your time to prepare for your interview, you’ll have a high chance of acing it!
However, Excel is just one of a number of the most common data analytics tools, so it is not the only area you will be asked about. There are lots of other topics that will come up in typical data analyst interview questions, so make sure to study up on those, too.
Since you’re here…
Considering a career in data analytics? We can get you there. Don’t take our word for it – check out our student reviews. After just 6 months of study in our fully flexible Data Analytics Bootcamp, we’ll boost you into a job in the field or your tuition back. Get started now with our free data analytics course.