
Free Data Analytics Course
Jumpstart your journey with 25 essential learning units in data analytics. No cost, just knowledge.
In my posts on data analysis methods and machine learning, I briefly mentioned data cleaning and its importance. Those two articles were not focused on data cleansing, so they were indeed brief mentions. However, the importance of using (relatively) clean data is paramount in machine learning and statistics.
Do We Really Need to Clean the Data?
Yes. Bad data will lead to bad results, plain and simple. The saying “garbage in, garbage out” is well-known in the computer science world for a reason. Computers are not magical gods, they’re machines performing calculations very rapidly. They have no insight or intuition, nor do they have intellect or sentience (as far as we know!) to determine when something “just doesn’t make sense.” So, it is very important for any data analysts to ensure the quality of a data.
To accurately reflect reality, our input data must remove errors and issues that trip up our algorithms. Data cleaning (or pre-processing, if you prefer) is how we do this. Data cleansing is a time-consuming and unpopular aspect of data analysis (PDF, p5), but it must be done.
Note 1: In this article, rows will be instances of datapoints while columns will be variable/field names. Row 1 may be Jane, row 2 may be John. Column 1 may be age, column 2 may be income.
Note 2: Most links to explain programming terms will link to Python resources, one of the most widely used data science languages. Common libraries are NumPy, SciPy, and pandas. If you haven’t programmed before, Python is a high-level, relatively intuitive language with many code libraries already created for you. I strongly recommend it for beginners.
What Causes Data to Be Unclean?
Data from real-world applications may be unstructured and therefore its capture automated. This leads to all kinds of consistency and quality issues in data analytics process. Sometimes data sets are aggregated from multiple sources, leading to other issues. Sometimes inputs are sourced from bad sensors. There are many reasons our data can be unusable for algorithms.
Input Errors
There are plenty of ways a human can enter the wrong information. They may mistype, miscalculate, or misread. For open-ended fields, like unverified text, there could be typos that a computer will not interpret as identical (e.g., “yes,” “yeah,” “Y”). For numeric fields, there could be confusion about magnitude (000s or 000,000s?). I’m sure you can think of myriad other ways humans can errantly enter data.
Malfunctioning Sensors
Machines can err, too. A washing machine sensor shouldn’t register 534 C for the water temperature. An elevator’s current load cannot equal -150 kilograms. Humans easily catch these errors, but computers will absolutely miss them (unless the code specifically checks for these errors).
Mangled Data
When sensors malfunction, they are likely to generate values outside the acceptable range (like a negative weight). Sometimes the sensors are generating valid data, but that data is mangled on its way to the collection site. Proprietary data formats may not be readable by different programs. Interference during public-internet transmission might cause dropped packets and thus partial input.
Duplicates
If the initial data set is an amalgamation of multiple sources, there is a high probability of duplicates. Sometimes these are not identified by a simple key check, because one data source might use the Name Sensor AA while another data source may use Device 01. Both entries are identical, but your algorithm relies on the Name field, thus double-counting the double-agent AA/01.
Lack of Standardization
When using multiple data sources, lack of standardization is common. To achieve true results, all data that is similar in reality must be represented similarly in the input. This is obvious, but it is not always obvious how to achieve this.
Even within single data source projects, standardization problems can still arise, particularly with open-ended human input. Some people might have different spelling or capitalization habits, and people on different teams within an organization may even use different names for the same topic or product!
Get To Know Other Data Analytics Students

Joel Antolijao
Data Analyst at FanDuel

Cleo Valencia
Student In The Data Analytics Bootcamp at Springboard

Sarah Ganihar
Business Intelligence Analyst at Amazon Web Services
Identifying Problematic Data
In this section, let’s explore some data constraints and how to approach them.
Range Constraints
One of the easiest restraints to check, and one of the easiest to understand, is the range constraint. Water is only physically water between 0 and 100 degrees Celsius. If your data says the water is 435 C, it isn’t water anymore. In fact, it’s steam—it’s steam at a very high pressure. Your washing machine is going to explode… If the reading is -30 C, your washer is probably frozen solid.
There is likely a “max” and a “min” function in your chosen language. You can very quickly check a range constraint this way. These are generally optimized as fundamental functions, too, so they will run quickly even on huge data sets. Another way is to use a Boolean mask and check for any values that violate the constraint, or graph your data and look for abnormal distributions.
Categorical Constraints
Categorical variable values can only be chosen from a specific set of options. A device can only be on or off. A marital status may only be single, engaged, married, divorced, or widowed. An animal may only be one species, and it must be a valid species.
You can check categorical constraints by running some kind of unique search function (in Python, in SQL) and viewing the output. If there are eight possible categories, your unique search should produce eight or fewer results. You can easily check that all the identified categories are legitimate.
Categories that contain many classes may require another method. DNA sequences come to mind, as there could be hundreds of unique and valid sequences in a single data set. If you have a list of all possible combinations, you can use a function that cross-references the input data with a set of known sequences. If you don’t, you might be able to use something like a Regex (regular expression), but that’s up to you to decide.
Consistency
The strings “Married,” “married,” and “mar.” will not be recognized as identical. If some columns are in 000s but a specific data source is quoting raw numbers, some of your rows will be off by three orders of magnitude. Percentages that are entered in decimal form will not be comparable to percentages entered in basis-point form.
You can find these, at least for categorical data with few classes, by manually reviewing the list of classes (use a unique function to find them all). Finding these errors for numeric data may require some ingenuity, though range constraints are a start.
Cross Field Constraints
This one is hardest to check because it doesn’t concern a single field. This constraint pertains to validity across columns or rows. For example, $100,000 may be a valid income, and 3 may be a valid age, but a datapoint of Alex with an age of 3 and an income of $100,000 is very unlikely. It can be even more complicated, like this example:
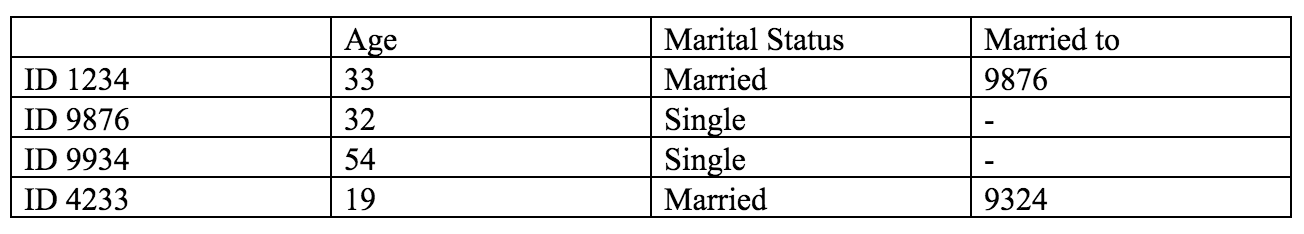
Obviously, one of these entries is incorrect. Finding out which one—and indeed just finding this cross-reference error—can be extremely difficult. If your project relies critically on the veracity of cross-column (age, income) or cross-row (1234 / 9876) information, you’ll need to develop code to catch these kinds of errors. Perhaps here you can simply iterate through every ID and ensure the relationship is reciprocal. 1234 should be married to 9876 and 9876 should be married to 1234. The same should appear for 4233 / 9324 and 9324 / 4233. Any deviations can be collected in a list and manually reviewed.
Visualizations
Visualizations are a good way to easily find outliers, strange distributions, and other problems. If you believe it is a normal distribution, but in fact you have a bimodal distribution, you will need to adjust your starting assumptions. Visualization techniques, like box-and-whisker plots, histograms, and scatterplots, can be immensely helpful in immediately catching some issues.
Visualizations will also assist you in identifying trends, which can be helpful in scaling. Excel has some of the most powerful visualization capabilities, but there are plenty of libraries in other languages like Python.
Counting the Errors
If you find constraint violations, you’ll want to count them. Just one may be a fluke. If 50% of the datapoints are in violation, there may be an inapplicable constraint or bad input data. Even if you use visualizations, make sure you also count the errors. If a sensor spits out 500 identical, invalid instances, they will all be hidden behind the same visual datapoint on the screen.
Missing Values
Missing values is probably the most common type of data issue that must be addressed. Values may be missing because you combined two data sets from different sources, the entry process somehow skipped a row, or the value was inadvertently deleted.
One or two missing values probably isn’t a problem, but if you notice there is a high density of missing values, you should investigate the reason. Is a sensor malfunctioning? Is a certain group conspicuously missing? If surveys are missing from all tenants in a particular building, perhaps the building management is avoiding distributing the surveys. This could be important in itself.
Missing values can often impart and imply a lot of information, so don’t just ignore them if they’re occurring frequently.
Data Cleaning Techniques
Once you’ve identified data to be cleaned, there are a few main ways to actually go about that data cleanup.
Removal
This is the most frowned-upon method. For missing values, it is better to investigate the reason instead of simply eliminating the rows or columns that contain the missing values. This is not always avoidable, though. If an entire column is 85% missing and you cannot find another data source, you may not be able to use that column.
Additionally, it’s not optimal to remove outliers, as this is a kind of results doctoring. If you do remove datapoints, explain the reasoning for doing so (such as 85% of the data is irrecoverable) in the results and report.
Before removing many datapoints, it’s important to get input from experts in the field. This is critically true if you want to remove an entire column. Removing the Tactile Strength column from an engineering study is probably a bad idea, since tactile strength may heavily influence the decision that comes out of the analysis.
The only datapoints regularly eliminated are duplicates that are clearly duplicates, and only when the presence of duplicates does not affect your assumptions or results.
Direct Correction
This one is a little more interesting, and if possible, infinitely better than removal. Consistency issues are often simple to fix, though they must be identified first.
For string consistency correction in smaller categorical sets, it can be trivial to run a unique values search and then write a couple of if-statements to replace errors. If you have something like city names, it may be difficult to go with explicit if-statements. You may want to use a fuzzy search and make corrections that way.
Numerical consistency errors, such as order of magnitude mismatches, are simple to fix by multiplication or division. Binary consistency issues can be corrected if you can accurately assign the non-binary input to one of the binary categories. In the set {on, off, broken}, you can probably safely map broken to off.
Errors that arise from malfunctioning sensors or human input errors should also be corrected from the source, if possible. If you are using publicly available or large-scale, one-time-collection data sets, though, this won’t be possible. In those cases, you may want to impute the values.
Scaling
Scaling changes the ranges of data so some features do not dominate solely because they naturally produce larger values. For example, temperature for a city tends to have a much smaller range than the population for a city. Distance-based algorithms will assign much greater importance to the population variable, possibly entirely ignoring the temperature variable. Scaling brings variables in line with each other while retaining the proportional relationships within the variable. This is seen when you convert to percentages or baseline to 100.
Imputation
This technique is most closely associated with filling in missing values, but it can be used for incorrect values, too, especially when a direct correction cannot be made.
Imputation is a fancy way to say guess. However, since we are in the field of data science, this will be a data-driven guess, not just a random guess. You can impute values with statistical indicators (like mean, median, mode), hot-decking, stratification, and others.
One approach is to replace every missing value with a statistical indicator. However, be very careful here. You may reinforce the pattern already gleaned from the known data, potentially masking a critical pattern belied by the fact that the data itself is missing. In our missing building survey example above, if you just used the mean score for all missing data, you may overlook a strong negative sentiment in that building (which was why the building manager “forgot” to distribute the survey).
Hot-decking fills in missing values by randomly selecting a value from the set of already-known values. Again, this can cause you to overlook important information belied by “missingness.” However, hot-decking won’t drag your whole data set toward a statistical indicator like repeatedly filling in statistical indicators does.
Finally, stratification is beneficial if you already know some patterns in your data. The heights of women are, on average, shorter than the heights of men. You could split your data set into men and women, then use those sub-indicators for replacement or hot-deck from the subsets of men and women. Is it perfect? No, but it’s better than using the indicators or hot-decking from the entire population.
If you have a mission-critical project and it’s absolutely impossible to retrieve the correct data, it is strongly recommended to look for known patterns in the data set and impute values in line with those known patterns. You want to avoid introducing your own or latent biases as much as possible when imputing data, so get a second opinion if you can.
Flagging
This is particularly useful for missing values when you don’t want to drop all of them. For numeric data, you can add another column to your data set and flag any missing values there. This will inform your algorithm of missing values, which may turn out to be influential. For categorical variables, simply create a “Missing” or “Unknown” class.
If your flagged variable becomes important, you will probably need to correct or impute values to reflect reality or gather any useful insights. If you cannot do this, ensure the report mentions this shortcoming.
Conclusion
Data cleansing is not glamorous, and most data scientists actually do not seem to enjoy this part of the job. However, it is absolutely vital to feed clean, qualify data into your machine learning algorithms if you want useful, truthful, and actionable insights.
Ready to learn more? Consider Springboard’s Data Analytics Career Track. You’ll master both the technical and business thinking skills to get hired—job guaranteed!
Since you’re here…
Switching to a career in data analytics is possible, no matter your background. We’ve helped over 10,000 students make it happen. Check out our free data analytics curriculum to gauge your interest, or go all-in with our Data Analytics Bootcamp.
![How To Become a Data Analyst [2023 Roadmap]](https://www.springboard.com/blog/wp-content/uploads/2022/03/how-to-become-a-data-analyst-2023-roadmap.jpg)