Free Data Analytics Course
Jumpstart your journey with 25 essential learning units in data analytics. No cost, just knowledge.
Learning Excel and utilizing all of its features can seem like a tall order. As a mentor for Springboard’s Business Analytics Course, I’ve seen students get lost and overwhelmed when using the software to tackle a new case study.
In order to assist students in their data analytics journeys, I’ve compiled a list of useful Excel functions for data analysis that will help learners focus their attention so they can start to think like a business analyst and develop a framework for working with data sets.
This list is by no means comprehensive, but it will help you build a solid foundation for your analytics work.
I’ve downloaded a data set of Starbucks’ drinks nutrition menu from Kaggle to illustrate the topics discussed below.
You can download it here and follow along.
Descriptive Statistics: Understanding Your Data
Descriptive statistics provides the data analyst with the tools to develop the most basic understanding of the data set/sample that they have gathered. An analyst can summarize and examine data from 10,000 miles up as opposed to getting lost in the minutiae.
Descriptive statistics gives analysts the ability to find the central tendency, variability, trends, outliers, or errors in the data that could go unnoticed had they just tried to scroll and read the data in its entirety making the overall data analytics process easier and more adaptable. When first analyzing a data set, these tools provide the essential first steps for understanding the issues present.
Descriptive Statistics Shortcut
To access descriptive statistics functions in Excel, select any cell in your workbook and enter “=” along with the name of the function you are trying to use. Excel will provide a drop-down selection for the function you’re looking for. Inside the brackets, insert the array of data that the function is analyzing.
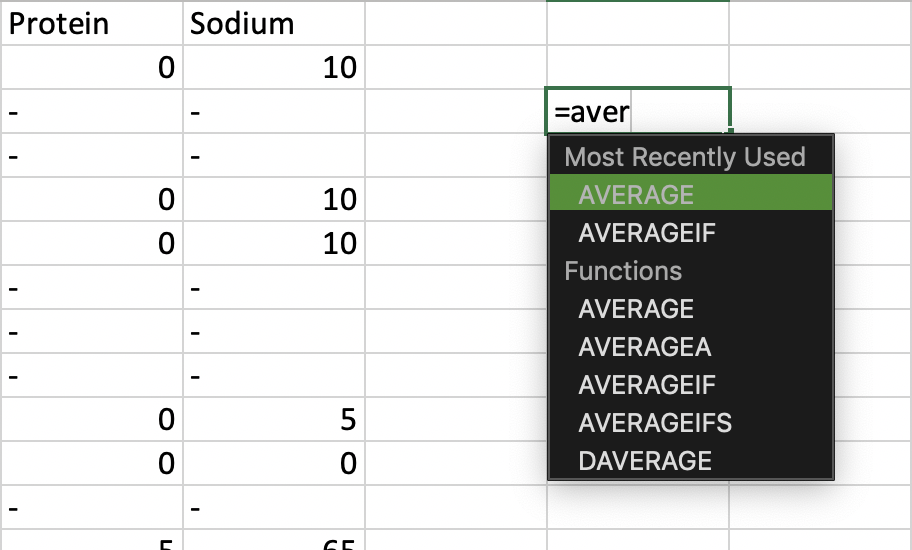
Figure 1 – The average function in Excel
The following list presents each descriptive statistic with its associated Excel function, accompanied by the Starbucks data:
Mean, Median, Mode, Minimum, Maximum, Range, Count, Standard Deviation, Percentile
- Mean:
- AVERAGE(Num1, Num2,…)
- AVERAGE calculates the arithmetic mean of an array of values and ignores cells that are not numbers, text, or blank
- Average fat SBUX drink: 2.34g
- AVERAGE calculates the arithmetic mean of an array of values and ignores cells that are not numbers, text, or blank
- AVERAGE(Num1, Num2,…)
- Median:
- MEDIAN(Num1, Num2,…)
- MEDIAN calculates the middle value of an array of values and ignores cells that are not numbers, text, or blank
- Median fat SBUX drink: 0g
- MEDIAN calculates the middle value of an array of values and ignores cells that are not numbers, text, or blank
- MEDIAN(Num1, Num2,…)
- Mode:
- MODE.SNGL(Num1, Num2,…) | MODE.MULT(Num1, Num2,…)
- MODE.SNGL returns the value that occurs with the most frequency in an array
- MODE.SNGL ignores cells that are not numbers, text, or blank
- Mode fat of SBUX drink: 0g
- MODE.MULT returns an array of the most frequently occurring values in an array. If more than one value represents the MODE in an array, MODE.MULT will output the values; otherwise, it will only output one value like MODE.SNGL
- MODE.MULT ignores cells that are not numbers, text, or blank
- To output, highlight the array of cells where MODE.MULT will return values and press CTRL + SHIFT + ENTER to output the array
- Mode multi fat of SBUX drink: 0g
- MODE.SNGL(Num1, Num2,…) | MODE.MULT(Num1, Num2,…)
- Minimum:
- MIN(Num1, Num2,…)
- MIN returns the smallest value in an array. MIN ignores cells that are not numbers, text, or blank
- Minimum fat SBUX drink: 0g
- MIN returns the smallest value in an array. MIN ignores cells that are not numbers, text, or blank
- MIN(Num1, Num2,…)
- Maximum:
- MAX(Num1, Num2,…)
- MAX returns the largest value in an array. MAX ignores cells that are not numbers, text, or blank
- Maximum fat SBUX drink: 26g
- MAX returns the largest value in an array. MAX ignores cells that are not numbers, text, or blank
- MAX(Num1, Num2,…)
- Range:
- MAX(Numb, Num2…) – MIN(Num, Num2…)
- Excel does not currently have a range function, but analysts can hack this by subtracting the MAX function from the MIN function of an array to see the dispersion of values of a variable
- Range fat SBUX drink: 26g
- Excel does not currently have a range function, but analysts can hack this by subtracting the MAX function from the MIN function of an array to see the dispersion of values of a variable
- MAX(Numb, Num2…) – MIN(Num, Num2…)
- Count:
- COUNT(Num1,Num2,…) | COUNTA(Num1, Num2…)
- COUNT counts the number of cells in an array that are numbers, dates, or text representations of numbers. COUNT ignores cells that are not numbers, text, or blank
- COUNTA counts the number of cells like COUNT, but also counts cells with any type of information. COUNTA only ignores empty cells
- COUNT fat SBUX drinks: 92
- COUNTA fat SBUX drinks: 177
- COUNT(Num1,Num2,…) | COUNTA(Num1, Num2…)
- Standard Deviation:
- STDEV.P(Num1,Num2,…) | STDEV.S(Num1,Num2,…)
- STDEV.P calculates the standard deviation and assumes the values represent all possible values in the population
- STDEV.P ignores logical and text cells
- STDEV.P calculates the standard deviation by the “n” method
- STDEV.P fat SBUX drinks: 3.87g
- STDEV.S calculates the standard deviation and assumes the values represent the sample of a population
- STDEV.S ignores logical and text cells
- STDEV.S calculates the standard deviation by the “n-1” method
- STDEV.S fat SBUX drinks: 3.89g
- STDEV.P(Num1,Num2,…) | STDEV.S(Num1,Num2,…)
To see the calculation differences between populations and sample standard deviations, click here.
- Percentile:
- PERCENTILE.INC([array], k)
- PERCENTILE.INC allows analysts to compare the relative rank of a value in an array of data
- The k in PERCENTILE.INC allows the analyst to specify the rank in the array
- k must be a value between 0 and 1, representing the 0th to the 100th percentile
- When a value is specified at the 60th percentile by computing PERCENTILE([array], .6), it can be interpreted in various ways
- The value output represents a point at which 60 percent of the data has a lower value
- Conversely, the value represents a point where 40 percent of the data has a higher value
- Starbucks percentile 50th: 0g fat
- Starbucks percentile 60th: 0.8g fat
- Starbucks percentile 70th: 2.5g fat
- Starbucks percentile 80th: 5.8g fat
- Starbucks percentile 90th: 7g fat
- PERCENTILE.INC allows analysts to compare the relative rank of a value in an array of data
- PERCENTILE.INC([array], k)
Having never studied the retail drink industry, we can now make data-centric inferences about how Starbucks designs its drinks menu. Although most drinks have 0g of fat, and at least 50 percent of the data set contains 0g of fat, its highest-fat drink contains 26g of fat. The data also appears to be incomplete, as only 92 of the 177 rows of data contain information related to the fat content of its drinks.
From the percentile perspective, drinks with fat greater than 7g constitute only 10 percent of the Starbucks drink list, which means that although it may have drinks with high fat content, they make up a small percentage of Starbucks’ overall product line. Making these tools a part of your repertoire as a business analyst will greatly improve your chances of finding unique and valuable insights for your organization.
Get To Know Other Data Analytics Students

Yogita Nesargi
Data Engineer at Deloitte

Cana Curtis
Research Analyst at Virginia Commonwealth University

Maura Fields
Data Analyst at Northeastern University
Filtering Tool: Dissecting Your Data

In analytics, analysts are faced with immense amounts of unstructured data that can often be confusing, complex, and messy. Data filtering enables the analyst to “filter” out pertinent information from the other data in order to generate reports or insights that address the business’ concern.
The filter tool exists on the headers of your data set. Once accessed, it allows you to pick and choose what data points to include/exclude in the analysis.

Figure 2 – Looking at the dropdown in the calories filter
Filter Tool Shortcut
To access the filter tool by keyboard shortcut for PCs or Macs, click anywhere inside the data set and press Ctrl + Shift + L. To remove the filter on the headers, simply press Ctrl + Shift + L again.

Figure 3 – Starbucks drinks table with filter tool
Logic Functions–IF, AND, OR: Transforming Your Data
It would be fantastic if we were given data sets that were clean, tidy, and contained all the variables necessary to develop the specific analyses our business leaders require. Unfortunately, this is rarely ever the case. Fortunately, Excel provides us with the ability to transform data sets at scale via the logic functions.
Logic functions allow data sets to be transformed by providing a way for the analyst to develop entirely new columns/rows of data based off of logical conditions from other columns in the data set.
In the following example, I utilize a nested IF() function to create an entirely new variable that categorizes the difference between drinks that contain fat and drinks that don’t. The equation also categorizes a N/A if there is no information available in the cell.
To interpret the equation, the conditions are: does cell C2 equal 0; if it does, input “No”. If the cell has a “-”, input “N/A”; otherwise, input “Yes” as it must mean that the cell has fat greater than 0.
It should be noted that this equation does not account for the fat variable being negative and could, in essence, “break” the ability for it to classify the data properly. However, after examining the data field previously with the filter tool, I can conclude that there are no negative values in the fat variable.

Figure 4 – Logic function on fat variable

Figure 5 – Logic function expanded to entire data set
You can find more information on logic functions here.
Since you’re here…
Interested in a career in data analytics? You will be after scanning this data analytics salary guide. When you’re serious about getting a job, look into our 40-hour Intro to Data Analytics Course for total beginners, or our mentor-led Data Analytics Bootcamp.