
Every IT job has an air of mystery to its roles and responsibilities. If you’re beginning a career in data science, you may be wondering what a day in the life of a data scientist looks like. There are several factors that influence the typical day for a data scientist – are you working for a start-up or a multinational company? Are you a full-time data scientist or an intern or a freelancer?
It is actually very difficult to describe a typical day in the life of a data scientist because when your day-to-day tasks involve building data products to solve problems for billions of people, it is not possible to have a “typical” day. Every day in the life of a data scientist is a new challenge. Finding out what a data scientist does isn’t a cakewalk. Yet, we will try to understand and decode what a typical day looks like in the life of a data scientist.
A Day in the Life of a Data Scientist – Decoded
- Defining the Data Science Problem
One of the most important and primary steps that every data scientist follows along the data science pipeline is to identify and define the business problem by asking a lot of right questions. Data is only as good as the questions you ask. Unless a data scientist asks the right questions, it cannot provide the right insights for better business decision-making. This involves various tasks such as understanding the business requirements, scoping an efficient solution, and planning the data analysis. Data scientists are responsible for analyzing the pain points of the stakeholders and framing a data science problem from a stakeholder’s perspective. They gain domain knowledge from stakeholders and combine it with the data and the technical knowledge to build a data product for better business gains.
- Gather Raw Data for Analysis of the Defined Problem
Having defined the business problem, a data scientist is responsible for collecting all the required data that will help them solve the business problem. The next important task in the data science pipeline is to identify the data sources they have to dig in to get all the relevant data, choose the required fields, and collate all relevant information in one place that might be required in the future. If the required data is already available with the organization, well and good. Otherwise, if a data scientist thinks that the available data is not enough to solve the business problem, they make arrangements to collect new data either through feedback from customers, surveys or by setting up a popular auto data collection paradigm like cookies for a website, etc. Once raw data is collected, a data scientist cleans and organizes the data(70% of a data scientist’s time is spent on this) to make corrections for any errors, remove missing values and identify duplicate records.
- Decide on an Approach to Solve the Data Science Problem
Having gathered all the data and understanding what questions they want to answer, a data scientist explores the best and most efficient methods to answer these questions. The best and most efficient might not always be the same and finding a trade-off solution is the responsibility of a data scientist. For instance, some of the questions can be answered by running a k- means clustering algorithm but this could be an expensive method particularly if it requires several iterations for a large dataset. However, these questions could also be answered with a simpler distance calculation method. A data scientist has to decide on the best method to approach a data science problem. There are various algorithmic approaches that can be applied to a data science problem, a few of them are listed below–
- Two-Class Classification Approach – works best for finding answers to questions that have only two possible answers.
- Multi-Class Classification Approach – works best for finding answers to questions that have multiple possible answers.
- Reinforcement Learning Algorithms – when your problem is not predictive in nature and requires you to figure out what are good actions.
- Regression – works best for questions that have a real-valued answer instead of a class or a category.
- Clustering – works best when you want to classify each data point into a specific group and answer questions about how data is organized.
- Perform in-depth Data Analysis – Apply Statistical Modelling, Algorithms, and Machine Learning
The data that comes from 2.1 billion mobile devices, 216 million computers that were sold last year, or let’s say 1 million tablets need to be analyzed to glean meaningful insights. A data scientist is responsible for building automated machine learning pipelines and personalized data products for profitable business decision-making. Having explored the data and decided on an approach, a data scientist analyses the data to get valuable information from it. There are several open-source data science tools and libraries in Python and R that can be used to analyze data and glean high-value insights for better business decision-making. There are chances that an approach decided on in the above Step 3 might not work when a data scientist actually begins to analyze the data. A data scientist then has to start trying other machine learning approaches and see what works best for their data science problem using the following 5-step approach –
- Build a machine learning model to answer the questions.
- Validate the model built against the data collected.
- Apply necessary algorithms and perform statistical analysis
- Present the results using various data visualization tools.
- Compare the results with other approaches.
A data scientist experiments with several models and approaches before finding the best solution for a data science problem.
- Communicate Insights to the Stakeholders
Having tweaked and optimized the model to obtain the best results, the next most important task of a data scientist is to effectively communicate the findings so various stakeholders can understand the insights and take further action based on them. A picture is worth a million datasets. Data scientists work with various data visualization tools like Tableau, QlikView, Matplotlib, ggplot, and others to demonstrate real-life cases on how the model is working on the actual customer. They create presentations with an appropriate flow to narrate a story the data can tell in a way that is easily comprehensible and compelling to the stakeholders.
Related Read: Data Scientist Job Description
Get To Know Other Data Science Students

Samuel Okoye
IT Consultant at Kforce

Ginny Zhu
Data Science Intern at Novartis

Isabel Van Zijl
Lead Data Analyst at Kinship
Meet Charlie Brown – Our Superhero Data Scientist
Charlie Brown is the name of our mental framework for an exemplary data scientist. Charlie has messy hair, wears round glasses, has intellectual curiosity, and has a proactive problem-solving attitude. Charlie is the fictional character that we will use as a thinking model in this blog post to understand what a data scientist does on a day-to-day basis.

Data scientists are all different, and most aspects of their responsibilities cannot be generalized as they are donned with multiple hats. Charlie is an example that we will consider a typical data scientist.
7 AM Wake Up – An Early Riser
Charlie’s day starts with the first cup of coffee, the start of many. Checks his emails for any alerts on the code that has been in operation through the night and reacts if necessary.
8 AM Head to Work – Commute
When working on complex data science projects, Charlie is intensely thinking about which machine learning approach would work best for his dataset on his commute to the office. On other days when the data product has already been built and the team is working on code polishing or other temporal activities, Charlie spends his commute time listening to some interesting data science podcasts or classic music.
9 AM Arrive at Work
Grab a cup of coffee and head to the desk. A busy day starts. Last week Charlie’s data science team released a new recommender engine. Charlie monitor’s the outcome of this recommender engine to see if there have been no surprises or critical issues during the night that need dealing with. Charlie then checks the infrastructure health and data pipeline to ensure everything is working as expected.
11 AM Sprints and Stand-up Meetings
Yesterday, Charlie has been working on optimizing and tuning the parameters of a random forest machine learning model. Today, he plans to evaluate the accuracy and variations in predictions of all the tuned parameters. Charlie and his team hold meetings with different cross-functional members. They have meetings with various stakeholders, the project managers, marketing, and sales, and mention what they’re working on and what they plan to work on next. The stakeholders brief the data scientists more in detail about the users and share the customer feedback reviews. This helps Charlie and his team understand their goals and how the data can be leveraged to achieve these goals.
There is another meeting that Charlie attends with peer data scientists and data analysts where his team presents the actual details of the project, shares the code and visualizations with each other, and discusses the progress. These meetings are typical task trackers to ensure that everyone in the data science team is on the same page and to ensure that there are no blockers. Charlie and his team use Jira task management platform to organize tasks to display sprints and group the tasks based on where they are in the data science process.
1 PM Lunch
Lunch is sometimes delayed not because Charlie is not hungry but because sometimes he gets so busy and engrossed in the code that he has his lunch only after he feels that he has made some progress towards analysis.
2 PM – 5 PM Code, Code, and Code
Developing a machine learning model requires several days, weeks, or months and there is a step-by-step process every data scientist follows. This is the time when actual requirements gathering, data preparation, exploratory data analysis, feature engineering, and model building takes place. Some days Charlie is building data cleaning or plumbing services using various data scientist tools, other days he could be doing some academic style-research and coding in Python (a widely-used programming language in the domain of data science) to implement a machine learning algorithm. He could also be performing analysis in the Jupyter notebook using SciKit learn or firing up PyCharm to code up a class that implements a machine learning model or interfaces with the database.
He could be using Spark MLlib library to churn machine learning models or do k-means clustering, or he could be prototyping in R using ML packages or could be creating beautiful data visualizations using Tableau or Qlikview to communicate the insights to stakeholders or he could be using Apache Hive to pull data or could be creating summaries by pulling data in an excel. Charlie also helps his team members to improve their machine learning models by testing the current model on real data and identifying any false negatives. He also creates new training examples to fix problems if any.
6 PM Code Revie
Having coded all day long, it’s time to let your peers know about the changes you have committed. Code reviews usually happen over conference calls or through in-person meetings. Charlie takes the help of other data scientists in his team when he is stuck with a code snippet and also makes it a point to explain the code to his peers so he knows his code better. The collaboration of new ideas and brainstorming happens in these meetings.
7 PM – End of a Hectic Day….Home Time!
Charlie heads back home but if there is any data science or tech event happening in his company he makes it a point to attend that so that he can learn new things from brilliant tech minds. Charlie likes to unwind during his evening by researching some latest data science trends and technologies to keep himself updated.
This is what a typical day in the life of a data scientist looks like but as already mentioned this varies from project to project, company to company, and person to person. There are many data science companies and hundreds of data scientists but the data science process and the tasks a data scientist will be involved in remain the same.
A day in the life of a data scientist is similar to the life of a writer who is always immersed in a deep state of concentration. A typical day in the life of a data scientist is never boring or dull, instead, it is full of challenges and opportunities to learn new things and solve new business problems.
There’s no question that learning data science can completely transform your career prospects. Data science skills are in-demand, with India alone likely to see a 62% increase in data science job openings. And the data science industry is also popular for its high salaries – the average data scientist salary is 10 lakhs per annum. If you like the sound of Charlie’s day and the perks a data scientist job entails, enroll in Springboard’s comprehensive, 1:1 mentor-led data science online program to become a qualified data scientist in 6 months with a job guarantee. If we can help you become a data scientist, it’ll be worth it.
And one more recap from Mozilla data scientist, Ryan:
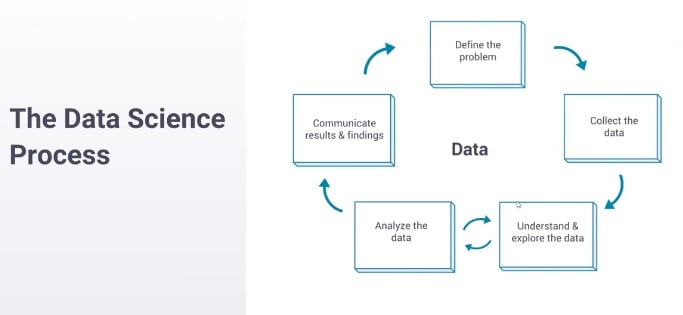
You start by defining a problem. You start with something that you want to understand better or a question that you want to answer. You move on to collecting data to answer that question. Then you enter this loop at the bottom here, where you oscillate between understanding the data and exploring the data—so, making some assertion about the data and then analyzing whether that’s true and whether you really do understand, and then going back and forth until you feel like you completely understand what the data is saying. Then you move on to communicating your results—and this is where you take what you’ve learned and you make it something that the company can use.
With that in mind, Ryan detailed the type of project a data scientist at Mozilla might work on.
Related Read: 6 Complete Data Science Projects, Plus Tips to Build Your Own
We have this feature called container tabs. It allows you to isolate personas when you’re online so you can have your work Gmail and your personal Gmail sitting next to each other and they don’t know that they’re both in the same browser, for example. So, I’ll take you through how we would actually analyze whether this change is useful. This is a pretty canonical data science question, at least at a tech company where we’re trying to run A/B experiments and figure out what features are good for our users.
1. Understand the problem: We start by understanding the problem, and this usually looks like sitting down with the person who owns this feature, who built this feature, and asking them: what does it do, what are you concerned about, how could this break the user experience, and what do you think this is going to do for your users? How would you characterize success, what does a happy user look like, and how do we win? So, we sit down in this meeting and I’m trying to build an understanding of what this feature is and then how we’re going to measure it.
2. Collecting data: Once I understand why they’re coming to me—are they trying to figure out if this feature is good? Are they trying to figure out if this feature’s good enough to launch (which is kind of a different question)? Are they trying to figure out if it causes pages to crash—may be a more narrow question? Once I understand what they’re trying to figure out, I can help them collect data.
So in this example, they want to answer some questions about causation. They want to know if launching this feature is good for the user, produces more users, produces happier users, or something like that. And because they’re trying to establish some type of causation like that, we need to run an experiment, which is different than—a lot of questions are just descriptive, right? So they’re asking questions like: how many users do we have in Germany? That’s something that we can answer quickly without running an experiment. We can just query the database and figure out the answer. This needs more. We need to separate users into groups, apply treatment, and understand what the actual effect is.
Something that we deal with at Mozilla that’s maybe [unique] to our process is that we spend a lot of time working on maintaining user privacy. We spend a lot of time thinking about: what’s the minimum amount of data that we can collect to be able to make sure that this is actually good for our users? This produces a bunch of data science questions that are difficult to answer. Can we fuzz the data to make sure we never know what one person did or can we just ask for, maybe, counts of websites instead of which websites? This adds a lot of complexity to the data collection process.
3. Understanding the data: To summarize, we understand the problem, we’ve decided that we’re going to run an experiment, we launch an experiment, and we collect some data. Moving on, once we have some data, we need to understand it. This process, like I said before, looks a lot like an oscillation.
So, we start off by making some assertions about the data: OK, there should be like a million rows in this data set. And then you look and you see there’s 15 million and you’re like, that’s not what I expected there to be. There’s an assertion there and there’s an analysis to figure out whether your assertion’s right and you just go through these frequently. OK, there’s 15 million instead of 1 million; what’s going on there? Oh, there are more users enrolled than I thought there would be because there are more people in Germany than I thought there would be. And you just keep oscillating through this until you come to a pretty complete understanding of what the data say.
So, you say something along the lines of why do these users leave, why is this metric so noisy? You say, oh there are outliers. The outliers are because of bots, so we can remove that. Finally, you have a complete understanding of the story. And if somebody asks you a question about the data, you can say: yeah, no, that’s not really a problem.
4. Communicating the results: Once you understand the data, you need to work on communicating the results so that other people can act on them. So this can be, you know, going into every meeting that people have about this feature and explaining why it’s good or bad. Usually, it’s more effective to produce some reports and make a launch/no launch assertion. So you say: this is good because of these reasons, this is what we observed, this is how we measured.
Something that I’ve been working on recently is building these reports effectively. And one of the things that I’ve been working on is building archival-quality reports, reports that don’t look different 10 years from now, which is unusually difficult to do when you’re working with something that’s on the internet, right? Things move, things break, things change. But the goal here is to be able to take what you’ve learned, put it down on paper so it distributes to a bunch of different people, so they can read and understand and change the way that they make decisions, and document this so well that in a few years we can reverse the decision that you suggested if everything’s changed—that’s, like, the gold standard of giving a great experiment report.
After talking through the life of an example project, Ryan discussed some of the tools he might use to accomplish that work.
You’re going to need some programming language—Python is what I use right now because it’s supported by our team. We have really good support for PySpark, which is the Python interface for Spark. Previously I’ve used R and I’ve been very happy with it. I use Jupyter notebooks a lot for exploration, but when I’m trying to communicate results or distill my knowledge I usually do it in Markdown or GDocs. And if it’s in Markdown, then it’s on GitHub, stored in Git.
These are some of the tools you’ll run into. These I think are pretty standard and useful across the industry. There are definitely more niche tools and the toolchains for data scientists are very, very varied because there are so many different types of jobs.
But what does a single day in the life of a data scientist like Ryan look like? He explains:
My time’s roughly split evenly between analysis, meetings, and review.
The analysis is me actually doing computation, writing queries, and trying to gauge something about the universe that isn’t understood right now.
Meetings and scoping analyses—these are understanding the problem and communicating my results out. I spend a lot of time in meetings trying to draw value from the analyses that I’ve done.
And then separately I spend a lot of time reviewing and answering questions for other folks. This can be something as simple as writing a quick query for a question that doesn’t need a lot of work or reviewing some more junior analyst’s analysis, or maybe even some PM’s analysis.
This changes with seniority. I’m a fairly senior now. When I started, I was doing a lot more analysis, a lot more drawing numbers, and a lot more building reports. As I’ve moved up I’ve produced more reviews. More senior people do a lot of reviews; mid-levels a lot of meetings, communication, and making sure the processes work. And then a lot of analysis for more junior members.
For more from Ryan, watch the full webinar.
Since you’re here…
Thinking about a career in data science? Enroll in our Data Science Bootcamp, and we’ll get you hired. If you’re just getting started, take a peek at our foundational Data Science Course, and don’t forget to peep at our student reviews. The data’s on our side.
Companies are no longer just collecting data. They’re seeking to use it to outpace competitors, especially with the rise of AI and advanced analytics techniques. Between organizations and these techniques are the data scientists – the experts who crunch numbers and translate them into actionable strategies. The future, it seems, belongs to those who can decipher the story hidden within the data, making the role of data scientists more important than ever.
In this article, we’ll look at 13 careers in data science, analyzing the roles and responsibilities and how to land that specific job in the best way. Whether you’re more drawn out to the creative side or interested in the strategy planning part of data architecture, there’s a niche for you.
Is Data Science A Good Career?
Yes. Besides being a field that comes with competitive salaries, the demand for data scientists continues to increase as they have an enormous impact on their organizations. It’s an interdisciplinary field that keeps the work varied and interesting.
10 Data Science Careers To Consider
Whether you want to change careers or land your first job in the field, here are 13 of the most lucrative data science careers to consider.
Data Scientist
Data scientists represent the foundation of the data science department. At the core of their role is the ability to analyze and interpret complex digital data, such as usage statistics, sales figures, logistics, or market research – all depending on the field they operate in.
They combine their computer science, statistics, and mathematics expertise to process and model data, then interpret the outcomes to create actionable plans for companies.
General Requirements
A data scientist’s career starts with a solid mathematical foundation, whether it’s interpreting the results of an A/B test or optimizing a marketing campaign. Data scientists should have programming expertise (primarily in Python and R) and strong data manipulation skills.
Although a university degree is not always required beyond their on-the-job experience, data scientists need a bunch of data science courses and certifications that demonstrate their expertise and willingness to learn.
Average Salary
The average salary of a data scientist in the US is $156,363 per year.
Data Analyst
A data analyst explores the nitty-gritty of data to uncover patterns, trends, and insights that are not always immediately apparent. They collect, process, and perform statistical analysis on large datasets and translate numbers and data to inform business decisions.
A typical day in their life can involve using tools like Excel or SQL and more advanced reporting tools like Power BI or Tableau to create dashboards and reports or visualize data for stakeholders. With that in mind, they have a unique skill set that allows them to act as a bridge between an organization’s technical and business sides.
General Requirements
To become a data analyst, you should have basic programming skills and proficiency in several data analysis tools. A lot of data analysts turn to specialized courses or data science bootcamps to acquire these skills.
For example, Coursera offers courses like Google’s Data Analytics Professional Certificate or IBM’s Data Analyst Professional Certificate, which are well-regarded in the industry. A bachelor’s degree in fields like computer science, statistics, or economics is standard, but many data analysts also come from diverse backgrounds like business, finance, or even social sciences.
Average Salary
The average base salary of a data analyst is $76,892 per year.
Business Analyst
Business analysts often have an essential role in an organization, driving change and improvement. That’s because their main role is to understand business challenges and needs and translate them into solutions through data analysis, process improvement, or resource allocation.
A typical day as a business analyst involves conducting market analysis, assessing business processes, or developing strategies to address areas of improvement. They use a variety of tools and methodologies, like SWOT analysis, to evaluate business models and their integration with technology.
General Requirements
Business analysts often have related degrees, such as BAs in Business Administration, Computer Science, or IT. Some roles might require or favor a master’s degree, especially in more complex industries or corporate environments.
Employers also value a business analyst’s knowledge of project management principles like Agile or Scrum and the ability to think critically and make well-informed decisions.
Average Salary
A business analyst can earn an average of $84,435 per year.
Database Administrator
The role of a database administrator is multifaceted. Their responsibilities include managing an organization’s database servers and application tools.
A DBA manages, backs up, and secures the data, making sure the database is available to all the necessary users and is performing correctly. They are also responsible for setting up user accounts and regulating access to the database. DBAs need to stay updated with the latest trends in database management and seek ways to improve database performance and capacity. As such, they collaborate closely with IT and database programmers.
General Requirements
Becoming a database administrator typically requires a solid educational foundation, such as a BA degree in data science-related fields. Nonetheless, it’s not all about the degree because real-world skills matter a lot. Aspiring database administrators should learn database languages, with SQL being the key player. They should also get their hands dirty with popular database systems like Oracle and Microsoft SQL Server.
Average Salary
Database administrators earn an average salary of $77,391 annually.
Data Engineer
Successful data engineers construct and maintain the infrastructure that allows the data to flow seamlessly. Besides understanding data ecosystems on the day-to-day, they build and oversee the pipelines that gather data from various sources so as to make data more accessible for those who need to analyze it (e.g., data analysts).
General Requirements
Data engineering is a role that demands not just technical expertise in tools like SQL, Python, and Hadoop but also a creative problem-solving approach to tackle the complex challenges of managing massive amounts of data efficiently.
Usually, employers look for credentials like university degrees or advanced data science courses and bootcamps.
Average Salary
Data engineers earn a whooping average salary of $125,180 per year.
Database Architect
A database architect’s main responsibility involves designing the entire blueprint of a data management system, much like an architect who sketches the plan for a building. They lay down the groundwork for an efficient and scalable data infrastructure.
Their day-to-day work is a fascinating mix of big-picture thinking and intricate detail management. They decide how to store, consume, integrate, and manage data by different business systems.
General Requirements
If you’re aiming to excel as a database architect but don’t necessarily want to pursue a degree, you could start honing your technical skills. Become proficient in database systems like MySQL or Oracle, and learn data modeling tools like ERwin. Don’t forget programming languages – SQL, Python, or Java.
If you want to take it one step further, pursue a credential like the Certified Data Management Professional (CDMP) or the Data Science Bootcamp by Springboard.
Average Salary
Data architecture is a very lucrative career. A database architect can earn an average of $165,383 per year.
Machine Learning Engineer
A machine learning engineer experiments with various machine learning models and algorithms, fine-tuning them for specific tasks like image recognition, natural language processing, or predictive analytics. Machine learning engineers also collaborate closely with data scientists and analysts to understand the requirements and limitations of data and translate these insights into solutions.
General Requirements
As a rule of thumb, machine learning engineers must be proficient in programming languages like Python or Java, and be familiar with machine learning frameworks like TensorFlow or PyTorch. To successfully pursue this career, you can either choose to undergo a degree or enroll in courses and follow a self-study approach.
Average Salary
Depending heavily on the company’s size, machine learning engineers can earn between $125K and $187K per year, one of the highest-paying AI careers.
Quantitative Analyst
Qualitative analysts are essential for financial institutions, where they apply mathematical and statistical methods to analyze financial markets and assess risks. They are the brains behind complex models that predict market trends, evaluate investment strategies, and assist in making informed financial decisions.
They often deal with derivatives pricing, algorithmic trading, and risk management strategies, requiring a deep understanding of both finance and mathematics.
General Requirements
This data science role demands strong analytical skills, proficiency in mathematics and statistics, and a good grasp of financial theory. It always helps if you come from a finance-related background.
Average Salary
A quantitative analyst earns an average of $173,307 per year.
Data Mining Specialist
A data mining specialist uses their statistics and machine learning expertise to reveal patterns and insights that can solve problems. They swift through huge amounts of data, applying algorithms and data mining techniques to identify correlations and anomalies. In addition to these, data mining specialists are also essential for organizations to predict future trends and behaviors.
General Requirements
If you want to land a career in data mining, you should possess a degree or have a solid background in computer science, statistics, or a related field.
Average Salary
Data mining specialists earn $109,023 per year.
Data Visualisation Engineer
Data visualisation engineers specialize in transforming data into visually appealing graphical representations, much like a data storyteller. A big part of their day involves working with data analysts and business teams to understand the data’s context.
General Requirements
Data visualization engineers need a strong foundation in data analysis and be proficient in programming languages often used in data visualization, such as JavaScript, Python, or R. A valuable addition to their already-existing experience is a bit of expertise in design principles to allow them to create visualizations.
Average Salary
The average annual pay of a data visualization engineer is $103,031.
Resources To Find Data Science Jobs
The key to finding a good data science job is knowing where to look without procrastinating. To make sure you leverage the right platforms, read on.
Job Boards
When hunting for data science jobs, both niche job boards and general ones can be treasure troves of opportunity.
Niche boards are created specifically for data science and related fields, offering listings that cut through the noise of broader job markets. Meanwhile, general job boards can have hidden gems and opportunities.
Online Communities
Spend time on platforms like Slack, Discord, GitHub, or IndieHackers, as they are a space to share knowledge, collaborate on projects, and find job openings posted by community members.
Network And LinkedIn
Don’t forget about socials like LinkedIn or Twitter. The LinkedIn Jobs section, in particular, is a useful resource, offering a wide range of opportunities and the ability to directly reach out to hiring managers or apply for positions. Just make sure not to apply through the “Easy Apply” options, as you’ll be competing with thousands of applicants who bring nothing unique to the table.
FAQs about Data Science Careers
We answer your most frequently asked questions.
Do I Need A Degree For Data Science?
A degree is not a set-in-stone requirement to become a data scientist. It’s true many data scientists hold a BA’s or MA’s degree, but these just provide foundational knowledge. It’s up to you to pursue further education through courses or bootcamps or work on projects that enhance your expertise. What matters most is your ability to demonstrate proficiency in data science concepts and tools.
Does Data Science Need Coding?
Yes. Coding is essential for data manipulation and analysis, especially knowledge of programming languages like Python and R.
Is Data Science A Lot Of Math?
It depends on the career you want to pursue. Data science involves quite a lot of math, particularly in areas like statistics, probability, and linear algebra.
What Skills Do You Need To Land an Entry-Level Data Science Position?
To land an entry-level job in data science, you should be proficient in several areas. As mentioned above, knowledge of programming languages is essential, and you should also have a good understanding of statistical analysis and machine learning. Soft skills are equally valuable, so make sure you’re acing problem-solving, critical thinking, and effective communication.
Since you’re here…Are you interested in this career track? Investigate with our free guide to what a data professional actually does. When you’re ready to build a CV that will make hiring managers melt, join our Data Science Bootcamp which will help you land a job or your tuition back!