
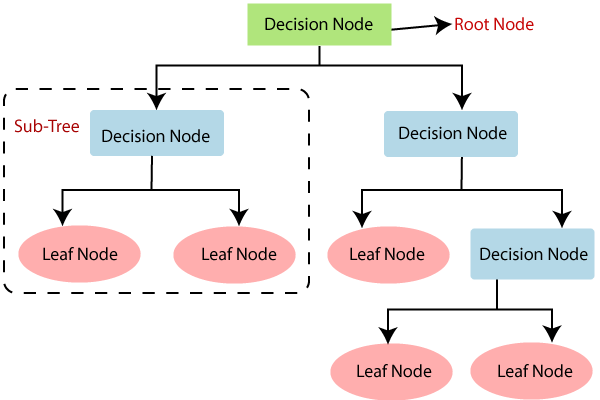
A decision tree is a simple representation for classifying examples. It is a supervised machine learning technique where the data is continuously split according to a certain parameter. Decision tree analysis can help solve both classification & regression problems. The decision tree algorithm breaks down a dataset into smaller subsets; while during the same time, an associated decision tree is incrementally developed. A decision tree consists of nodes (that test for the value of a certain attribute), edges/branch (that correspond to the outcome of a test and connect to the next node or leaf) & leaf nodes (the terminal nodes that predict the outcome) that makes it a complete structure. In this blog post, we are going to learn about the decision tree implementation in Python, using the scikit learn Package.
For our analysis, we have chosen a very relevant, and unique dataset which is applicable in the field of medical sciences, that will help predict whether or not a patient has diabetes, based on the variables captured in the dataset (more datasets here). This information has been sourced from the National Institute of Diabetes, Digestive and Kidney Diseases and includes predictor variables like a patient’s BMI, pregnancy details, insulin level, age, etc. Let’s dig right into solving this problem using a decision tree algorithm for classification.
Decision Tree Implementation in Python
As for any data analytics problem, we start by cleaning the dataset and eliminating all the null and missing values from the data. In this case, we are not dealing with erroneous data which saves us this step.
1. We import the required libraries for our decision tree analysis & pull in the required data
# Load libraries
import pandas as pd
from sklearn.tree import DecisionTreeClassifier # Import Decision Tree Classifier
from sklearn.model_selection import train_test_split # Import train_test_split function
from sklearn import metrics #Import scikit-learn metrics module for accuracy calculation
col_names = ['pregnant', 'glucose', 'bp', 'skin', 'insulin', 'bmi', 'pedigree', 'age', 'label']
# load dataset
pima = pd.read_csv("pima-indians-diabetes.csv", header=None, names=col_names)
Let’s check out what the first few rows of this dataset look like
pima.head()
2. After loading the data, we understand the structure & variables, determine the target & feature variables (dependent & independent variables respectively)
#split dataset in features and target variable
feature_cols = ['pregnant', 'insulin', 'bmi', 'age','glucose','bp','pedigree']
X = pima[feature_cols] # Features
y = pima.label # Target variable
3. Let’s divide the data into training & testing sets in the ratio of 70:30.
# Split dataset into training set and test set
X_train, X_test, y_train, y_test = train_test_split(X, y, test_size=0.3, random_state=1) # 70% training and 30% test
As a standard practice, you may follow 70:30 to 80:20 as needed.
4. Performing The decision tree analysis using scikit learn
# Create Decision Tree classifier object
clf = DecisionTreeClassifier()
# Train Decision Tree Classifier
clf = clf.fit(X_train,y_train)
#Predict the response for test dataset
y_pred = clf.predict(X_test)
5. But we should estimate how accurately the classifier predicts the outcome. The accuracy is computed by comparing actual test set values and predicted values.
# Model Accuracy, how often is the classifier correct?print("Accuracy:",metrics.accuracy_score(y_test, y_pred))

Accuracy: 0.6753246753246753
Looks like our decision tree algorithm has an accuracy of 67.53%. A value this high is usually considered good.
6. Now that we have created a decision tree, let’s see what it looks like when we visualise it
The Scikit-learn’s export_graphviz function can help visualise the decision tree. We can use this on our Jupyter notebooks. In case you are not using Jupyter, you may want to look at installing the following libraries:
- Graphviz -converts decision tree classifier into dot file
- Pydotplus- convert this dot file to png or displayable form on Jupyter.
from sklearn.tree import export_graphviz
from sklearn.externals.six import StringIO
from IPython.display import Image
import pydotplus
dot_data = StringIO()
export_graphviz(clf, out_file=dot_data,
                filled=True, rounded=True,
                special_characters=True,feature_names = feature_cols,class_names=['0','1'])
graph = pydotplus.graph_from_dot_data(dot_data.getvalue())
graph.write_png('diabetes.png')
Image(graph.create_png())
Is this the outcome that you seem to be getting too?

You will notice, that in this extensive decision tree chart, each internal node has a decision rule that splits the data. But are all of these useful/pure?
Measuring the Impurity of Nodes Created Via Decision Tree Analysis
Gini referred to as Gini ratio measures the impurity of the node in a decision tree. One can assume that a node is pure when all of its records belong to the same class. Such nodes are known as the leaf nodes.
In our outcome above, the complete decision tree is difficult to interpret due to the complexity of the outcome. Pruning/shortening a tree is essential to ease our understanding of the outcome and optimise it. This optimisation can be done in one of three ways:
- criterion: optional (default=”gini”) or Choose attribute selection measure
This parameter allows us to use the attribute selection measure. - splitter: string, optional (default=”best”) or Split Strategy
Allows the user to split strategy. You may choose “best” to choose the best split or “random” to choose the best random split. - max_depth: int or None, optional (default=None) or Maximum Depth of a Tree
This parameter determines the maximum depth of the tree. A higher value of this variable causes overfitting and a lower value causes underfitting.
In our case, we will be varying the maximum depth of the tree as a control variable for pre-pruning. Let’s try max_depth=3.
# Create Decision Tree classifier object
clf = DecisionTreeClassifier(criterion="entropy", max_depth=3)

# Train Decision Tree Classifier
clf = clf.fit(X_train,y_train)

#Predict the response for test dataset
y_pred = clf.predict(X_test)

# Model Accuracy, how often is the classifier correct?print("Accuracy:",metrics.accuracy_score(y_test, y_pred))

Accuracy: 0.7705627705627706
On Pre-pruning, the accuracy of the decision tree algorithm increased to 77.05%, which is clearly better than the previous model.
Get To Know Other Data Science Students

Sam Fisher
Data Science Engineer at Stratyfy

Mengqin (Cassie) Gong
Data Scientist at Whatsapp

Jonas Cuadrado
Senior Data Scientist at Feedzai
Decision Tree Implementation in Python: Visualising Decision Trees in Python
from sklearn.externals.six import StringIO
from IPython.display import Image
from sklearn.tree import export_graphviz
import pydotplus
dot_data = StringIO()
export_graphviz(clf, out_file=dot_data,
                    filled=True, rounded=True,
                    special_characters=True, feature_names = feature_cols,class_names=['0','1'])
graph = pydotplus.graph_from_dot_data(dot_data.getvalue())
graph.write_png('diabetes.png')
Image(graph.create_png())
With this, your outcome would look like:

The outcome of this pruned model looks easy to interpret. With this, we have been able to classify the data & predict if a person has diabetes or not. Decision tree in python is a very popular supervised learning algorithm technique in the field of machine learning (an important subset of data science), But, decision tree is not the only clustering technique that you can use to extract this information, there are various other methods that you can explore as a ML engineer or data scientists.
Since you’re here…
Curious about a career in data science? Experiment with our free data science learning path, or join our Data Science Bootcamp, where you’ll get your tuition back if you don’t land a job after graduating. We’re confident because our courses work – check out our student success stories to get inspired.