
Free Data Analytics Course
Jumpstart your journey with 25 essential learning units in data analytics. No cost, just knowledge.
The term “data analysis” can be a bit misleading, as it can seemingly imply that data analysis is a single step that’s only conducted once. In actuality, data analysis is an iterative process. And while this is obvious to any experienced data analyst, it’s important for aspiring data analysts, and those who are interested in a career in data analysis, to understand this too.
Want to learn more about the data analysis process and how it’s used? Then you’re in the right place. Below, we’ll tell you all about the data analysis process, the different steps of the process, how data analysis is used, and how to do it the right way.
Ready? Then let’s get started!
What Is Data Analysis?
Data analysis starts with identifying a problem that can be solved with data. Once you’ve identified this problem, you can collect, clean, process, and analyze data. The purpose of analyzing this data is to identify trends, patterns, and meaningful insights, with the ultimate goal of solving the original problem.
Is There a Specific Process for Data Analysis?
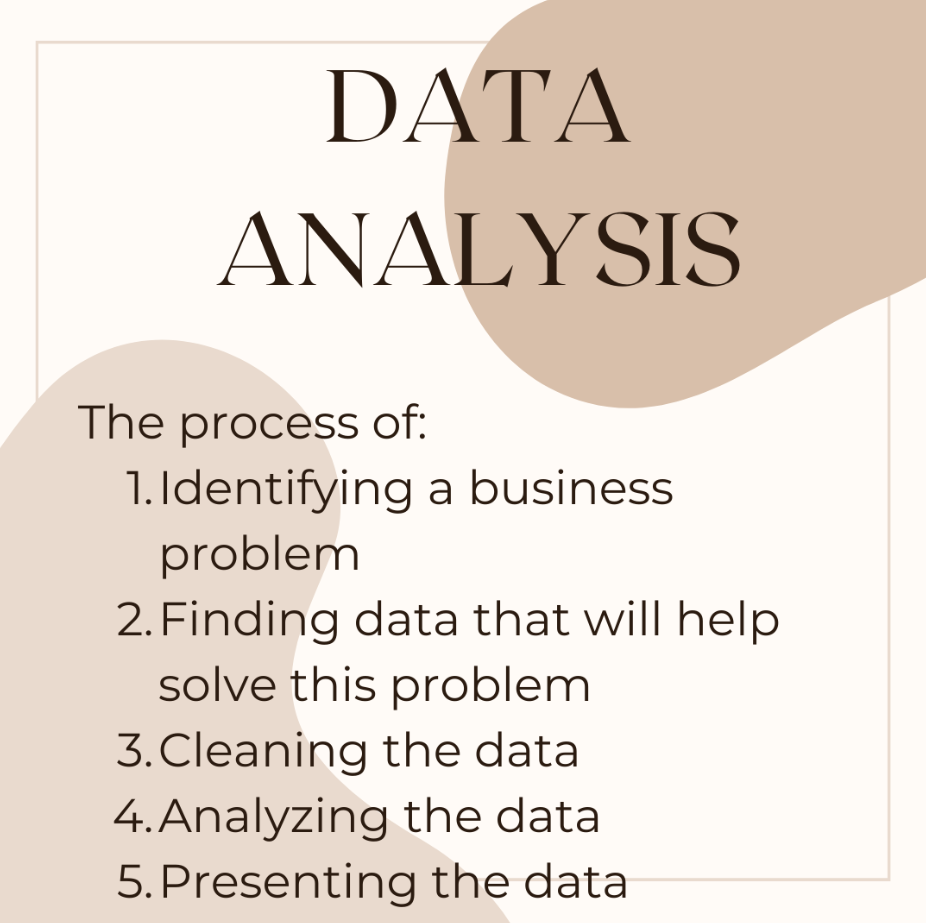
There is indeed a specific process for data analysis. Suppose you are looking to create the best recipe for pizza dough. You could frame your problem as a lack of knowledge—not having a sufficient pizza dough recipe.
What data could help you solve this problem? One way would be to comb through the plethora of online recipes available. You could then sort this data, filtering out recipes with low reviews or comments noting flaws in the recipe. Then, once you’ve collated the best recipes, you can begin to analyze them. What are the commonalities that emerge? Maybe you find that the best recipe depends on the style of pizza you want to make and that it’s best to group certain recipes together. The data analysis process won’t create the perfect pizza dough recipe for you, but it can get you headed in the right direction.
The Data Analysis Process
Let’s take a more in-depth look into the data science process:
Establish the Purpose of the Process
This is arguably the most critical step, as it can set you up for success. The purpose is often defined as a business question or problem statement related to your organization’s goals. Examples include:
- Would customers respond positively to the launch of X product?
- What are some ways to reduce employee attrition?
- Will incorporating AI tools reduce production costs?
Data Collection
Once you’ve defined the problem, then you can start collecting data. Broadly speaking, there are three different categories of data, and the ones you use will depend on the nature of your problem. Most data analysis problems require a combination of the three.
First-party data is data that your own organization generates. Oftentimes, this is data about previous customer interactions that can be used to make accurate predictions about your customers’ behavior in the future.
You could also use second-party data—data that’s generated by external sources, but is about your company specifically. This can include what customers are saying on social media platforms or review websites.
Third-party data comes from groups like think tanks and government sources and is more concerned with the nature of your customer base, rather than a specific interaction that a customer has had with your company.
Data Cleaning
Not all the data you collect will be useful or accurate, and you’ll need to discard the data points that are irrelevant, duplicated, inconsistent, or outdated.
This is called data cleaning. When combining multiple sources of data, you’ll likely wind up with duplicates and outliers. And when you’re dealing with millions of data points, as is often the case with data analysis, you can’t comb through each piece of data on your own to find the duplicates or outliers. Data analysts estimate that the time spent cleaning data consumes about 70-90% of the data analysis process.
At this stage, you can also do an exploratory analysis, which is an initial and cursory data analysis. Exploratory data analysis will also assist with identifying other data points you may need.
Data Processing
Once you have all the relevant data, you can begin to process it. This entails organizing the data, sorting the data into relevant categories, and labeling them for easy organization. Now the data is prepped for analysis.
Data Analysis
Data analysis can be done in numerous ways. One way is to use algorithms and mathematical models to manipulate data variables, which helps extract relevant information and valuable insights that tie into the problem defined in the first step.
Types of Data Analysis
Let’s look at the various data analysis techniques, which can be used in combination, depending on your problem.
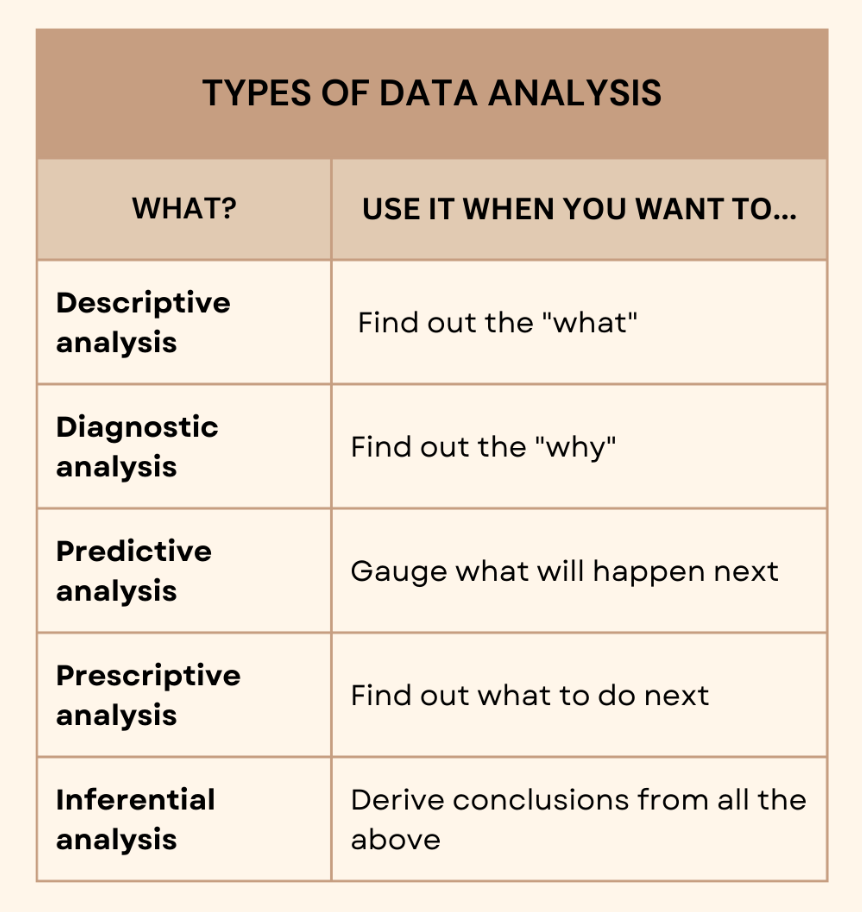
Descriptive Analysis
As the name suggests, descriptive analysis describes or summarizes the data and its characteristics. It doesn’t go beyond explaining what has happened. You use this type of data analysis to deliver a narrative of what has occurred. Descriptive statistics and analysis present scattered data into digestible pointers. You can also do a part of this at the stage of exploratory data analysis.
Diagnostic Analysis
With diagnostic analysis, you begin to focus on the “why,” and diagnose why something is occurring. At this stage, you are not looking for solutions or predictions. The goal is to understand the factors that are contributing to the problem. You use this technique when you want to go into issue identification mode.
Predictive Analysis
Here’s where you start generating forecasts based on your data. Data analysts perform predictive analysis when they want to establish a situation in the future. This prediction helps stakeholders gauge business performance.
Prescriptive Analysis
This kind of analysis brings together all of these data analysis techniques to offer recommendations. These form the basis of data-driven decisions.
Inferential Analysis
With this technique, you derive conclusions based on the data you have collected and analyzed, such as, “lack of employee training is a cause of employee attrition” or “employee attrition affects customer satisfaction.”
Data Visualization and Presentation
Data visualization is a vital skill, especially when presenting your findings to non-technical stakeholders. Using data visualization tools you can share your insights with stakeholders and other target audiences. The statistical analysis needs to be easy to understand and easier to apply while making data-driven decisions. Interactive dashboards and visual representations of your findings will help.
Biases and Pitfalls To Avoid in the Data Analysis Process
Be mindful of these biases throughout the data analysis process:
Selection Bias
Selection bias happens when you’re collecting data and cleaning it. There are several types of data analysis, including:
- Attrition bias. When participants who leave the research study have similar characteristics, leaving the participant pool skewed in terms of diversity.
- Sampling bias. When your study is based on information from specific categories of people while excluding others. This makes the data (and, therefore, the analysis) non-representative. There are several sub-types of sampling bias:
- Self-selection bias. When the study gives the sample a choice to participate in the study. Those who are not inclined to respond to the survey or questionnaire because they are just not interested will likely be from similar groups. This will affect the inclusivity of the study.
- Survivorship bias. When the study or survey results focus only on the results that are favorable to their purpose.
- Undercoverage bias. When the study excludes entire target groups.
- Non-response bias. When a significant category of people gets excluded from the study because they haven’t responded due to poorly constructed questionnaires, forgetfulness, or plain refusal.
Confirmation Bias
Confirmation bias is when you use data to support a pre-determined conclusion, rather than seeing what conclusions the data offers. You can avoid confirmation bias by covering all angles of the argument or problem. Give each perspective equal importance.
Outlier Bias
When organizations ignore anomalies in data to show a more streamlined picture, they engage in outlier bias. The most common example of outlier bias is revenue projections based on an average of factors, with well-performing variables hiding failures.
Other Pitfalls
The biases we spoke about can be a result of shoddy data analysis or a consequence of other unavoidable pitfalls. These include:
- Not using quality data
- Not properly cleaning data
- Not siloing data appropriately
You can avoid these pitfalls by having a clear strategy based on robust statistical analysis and data collection. Knowing the level of data readiness within your organization is also an excellent way to prevent unwanted surprises. Most of all, your analysis should always be tied to a core business question.
Get To Know Other Data Analytics Students

Sarah Ganihar
Business Intelligence Analyst at Amazon Web Services

Shelly Applegate
Sales BI Analyst at Mars Corporation

Cana Curtis
Research Analyst at Virginia Commonwealth University
Tools for Data Analysis
Here are the top tools for data analysis. They will help you collect, clean and mine data for efficient analysis:
Microsoft Excel
An advanced understanding of Excel will help you clean and visualize your data. It allows you to use charts and conditional formatting to identify trends and patterns. You can perform the following activities with Excel:
- Regression analysis
- Statistical analysis
- Inferential statistics
- Descriptive statistics
- Exploratory data analysis
RapidMiner
As the name suggests, this tool is primarily used for data mining. But you can also use it for various statistical techniques, such as inferential statistics and descriptive statistics, to generate summaries and conclusions.
Tableau
Tableau is a data visualization platform that allows you to share insights, collaborate over data analysis tasks, and share reports with stakeholders. Tableau has robust analytical features, such as limitless what-if analysis, and enables you to perform calculations with as many types of variables as you need.
Apache Spark
Apache Spark helps with large-scale data engineering, regression analysis, and exploratory analysis, allowing you to analyze massive datasets.

FAQs About the Data Analysis Process
We’ve got the answers to your most frequently asked questions:
What Is Data Analysis Used For?
Data analysis is used in many ways, but its most common applications include tracking customer behavior based on their purchase decisions, buying habits, and other consumer data points. Businesses then use this data to offer recommendations, improve customer experiences, inform marketing campaigns, and guide new product launches.
Why Is Data Cleaning Important for Data Analysis?
Garbage in, garbage out. Data cleaning is important for data analysis because data sources can be inconsistent, unreliable, and inaccurate. And no matter the size of your datasets, you’ll need to remove duplicate entries and outliers.
Is Data Analysis Easy To Learn?
Data analysis is easy to learn if you have a plan. And that plan needn’t include a college degree. Today, data analysis bootcamps, like Springboard’s Data Analysis Career Track, can get you job-ready much quicker than a traditional university. Springboard also offers a money-back guarantee, so if you don’t land a job soon after graduation, then you’ll receive a full refund!
Since you’re here…
Interested in a career in data analytics? You will be after scanning this data analytics salary guide. When you’re serious about getting a job, look into our 40-hour Intro to Data Analytics Course for total beginners, or our mentor-led Data Analytics Bootcamp.