Free Data Analytics Course
Jumpstart your journey with 25 essential learning units in data analytics. No cost, just knowledge.
While the use of data science for marketing and e-commerce is well-documented (eg: predicting which customers will churn or which offers they’re most likely to respond to), predictive analytics also has the power to make a major social impact. In 2015, DrivenData partnered with Yelp and Harvard University to design a predictive analytics solution to improve health inspections at restaurants in Boston. Typically, the process is time-consuming, and random spot checks don’t necessarily target the places that are most at risk of health code violations.
In this project, data scientists collected data from social media sites and reviews sites like Yelp and combined this with data on historical hygiene violation records to narrow the search for health code violations in Boston, pulling out the words, phrases, ratings, and patterns that predict violations to help public health inspectors do their jobs more effectively. According to the Centers for Disease Control, more than 48 million Americans per year become sick from food, and an estimated 75% of outbreaks come from food prepared by caterers, delis, and restaurants.
Predictive analytics is the science of using data to predict future outcomes. Learn more about the top 10 predictive analytics techniques and how to master each one.
What Is Predictive Analytics?
Predictive analytics represents the use of historical data to train machine learning models to predict future outcomes based on computations made by statistical algorithms. Organizations are turning to predictive analytics to solve business problems—such as determining which products to market to specific customer segments and on which platforms—and unearth new insights from their data. Mathematically speaking, predictive modeling involves approximating a mapping function (f) from input variables (X) to output variables (Y).
The most common use cases include optimizing marketing campaigns based on historical customer data, detecting fraud by analyzing patterns of criminal behavior, and forecasting inventory or setting prices. For example, airlines use predictive analytics to set ticket prices by forecasting seat availability and demand.
In fact, predictive analytics is an increasingly important decision-making tool. The ability to merge data from multiple sources and improve prediction accuracy empowers businesses to gain insights from their data. The global market for predictive analytics is set to attain a $10.95 billion valuation by 2022, up from $3.49 billion in 2016, according to a report issued by Zion Market Research.
That said, studies show that businesses aren’t capturing the full potential of big data for which the demand of both data analysts and data scientists are increasing. According to the 2016 McKinsey Global Institute report The Age of Analytics: Competing in a Data-Driven World, only 50% to 60% of potential value is captured in the location-based data industry.
Data has been such an integral part of Starbucks’ success that the coffee giant was recently characterized as “not a coffee business but a data tech company.” Starbucks gathers data from over 100 million transactions a week at over 300,000 stores worldwide and uses this data to make strategic decisions—from delivering personalized promotions through its mobile app to determining store locations.
Aside from helping businesses to acquire and retain customers, predictive analytics also helps businesses minimize risk and detect criminal behavior.
Top 10 Predictive Analytics Techniques
Predictive analytics uses a variety of statistical techniques, as well as data mining, data modeling, machine learning, and artificial intelligence to make predictions about the future based on current and historical data patterns. These predictions are made using machine learning models like classification models, regression models, and neural networks.
1. Data mining
Data mining is a technique that combines statistics and machine learning to discover anomalies, patterns, and correlations in massive datasets. Through this process, businesses can convert raw data into business intelligence—real-time data insights and future predictions that inform decision-making. Data mining involves sifting through repetitive, noisy, unstructured data and discovering patterns that surface relevant insights. Exploratory data analysis (EDA) is a type of data mining technique that involves analyzing datasets to summarize their main characteristics, often with visual methods. EDA does not involve any hypothesis testing or the intentional search for a solution; it is about probing the data in an objective manner, with no expectations. Traditional data mining, on the other hand, focuses on finding solutions from the data or solving a predefined business problem using data insights.
Related Read: 10 Best Data Mining Courses To Grow Your Data Skills
2. Data warehousing
Data warehousing is the foundation of most large-scale data mining efforts. A data warehouse is a type of data management system designed to enable and support business intelligence efforts. It does this by centralizing and consolidating multiple data sources, such as application log files and transactional data from POS (point of sale) systems. Typically, a data warehouse consists of a relational database to store and retrieve data, and an ETL (Extract, Transfer, Load) pipeline to prepare the data for analysis, statistical analysis tools, and client analysis tools for visualizing the data and presenting it to clients.
3. Clustering

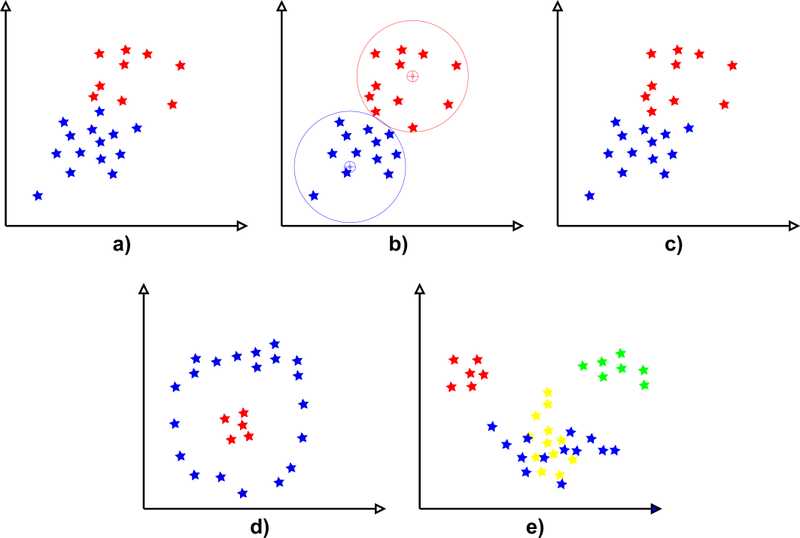
Clustering is one of the most popular data mining techniques, which uses machine learning to group objects into categories based on their similarities, thereby splitting a large dataset into smaller subsets. For example, clustering customers based on similar purchase habits or lifetime value, thereby creating customer segments and enabling the business to create personalized marketing campaigns at scale. Hard clustering means data points are directly assigned to categories. Soft clustering assigns a probability that a data point belongs in one or more clusters, rather than assigning that data point to a cluster. K means clustering is one of the most popular unsupervised machine learning algorithms. This technique involves looking for a fixed number of clusters in a dataset based on a target number ‘k.’ Each data point is allocated to a cluster by reducing the in-cluster sum of squares.
4. Classification
Classification is a prediction technique that entails calculating the probability that an item belongs to a particular category. A problem with two classes is called a binary classification problem, while a problem with more than two classes is a multi-class classification problem. Classification models generate a continuous value that expresses the probability that an observation belongs to a particular class—also known as confidence. A predicted probability can be converted into a class label by selecting the class that has the highest probability. The most common example of classification in a commercial use case is spam filters that label incoming emails as ‘spam’ or ‘not spam’ based on predefined criteria, or fraud detection algorithms that flag anomalous transactions.
5. Predictive modeling
Predictive modeling is a statistical modeling technique in which probability and data mining are used to predict future events. These predictions are then used to inform future actions or decisions, such as determining how much fresh produce a restaurant should stock on a federal holiday or how many calls a customer support agent should be expected to field in one day.
Get To Know Other Data Analytics Students
Sarah Savage
Content Data Analyst at EdX
Cleo Valencia
Student In The Data Analytics Bootcamp at Springboard
Reagan Tatsch
Data Operations Manager at ISS
6. Logistic regression
Logistic regression modeling is one of the primary tools for predictive modeling. The main purpose of regression techniques is to find correlations between inputs and outputs in the form of a linear expression that describes the strength of the relationship in the form of a mathematical formula. The formula expresses the outputs as a function of the inputs plus a constant. This linear relationship is then used to predict the future numerical value of a variable. For example, a regression model can show the correlation between house prices and interest rates, and use the linear expression to predict future house prices given interest rate ‘X.’ The variable that is being predicted is called the dependent variable, while the factors used to predict the value of the dependent variable are known as independent variables. There are two types of regression models: simple linear regression (one dependent variable and one independent variable) and multiple linear regression (one dependent variable and multiple independent variables).
7. Decision trees
A decision tree is a supervised learning algorithm and a popular method for visualizing analytical models. Decision trees assign inputs to two or more categories based on a series of “if…then” statements (known as indicators) arranged in the form of a flow diagram. A regression tree is used to predict continuous quantitative data, such as a person’s income. Qualitative predictions involve a classification tree, such as a tree that predicts a diagnosis based on a person’s symptoms. The goal of using a decision tree is to create a training model that can predict the class or value of an input variable by learning simple decision rules inferred from training data.
8. Time series analysis
Time series analysis is a method for analyzing time-series data. Time series models predict future values based on previously observed values. A time series is a sequence of data points that occur over a period of time—for example, changes in average household income or the price of a share over time. In this case, the predicted values occur along a continuum relative to time. They are most useful for predicting behavior or metrics over a period of time, or in decisions that involve a factor of uncertainty over time.
9. Neural networks

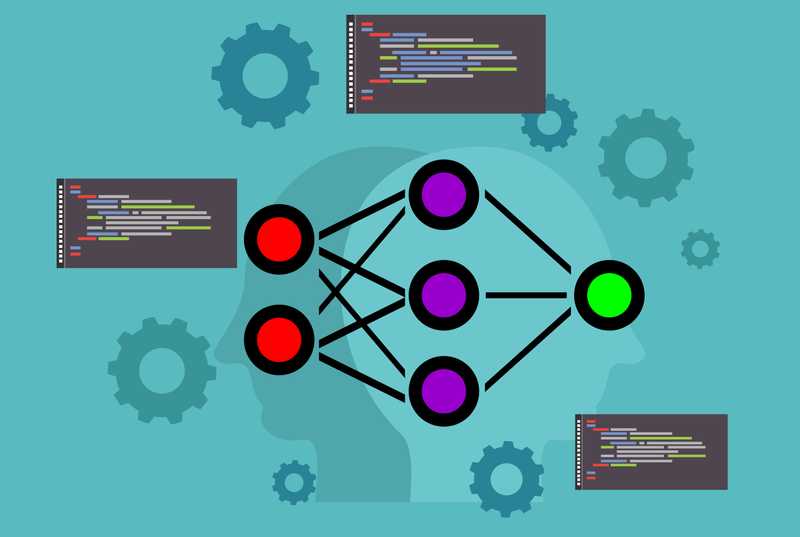
Widely used for data classification problems, neural networks are biologically inspired by the human brain. Most neural networks use mathematical equations to activate the neurons, where each input corresponds to an output. A neural network is made by creating a web of input nodes (which is where you insert the data), output nodes (which show the results when the data has passed through the network), and a hidden layer between these nodes. The hidden layer is what makes the network smarter than traditional predictive tools, because it “learns” the way a human would, by remembering past connections in data and incorporating this data in the algorithm. However, this hidden layer represents a ‘black box,’ meaning that even data scientists cannot necessarily understand how the algorithm produces its computations—only the inputs and outputs can be observed directly.
10. Artificial intelligence and machine learning
In the context of predictive modeling, machine learning is a method of computational learning that analyzes the data and creates a model that fits the data. For example, if historical data shows that students with a higher GPA tend to earn higher incomes, the algorithm will predict income as a function of GPA. Unfortunately, these machine learning models are essentially black boxes, where the models are derived directly from the data as a consequence of machine learning, without relying on explicit programming by a human. Consequently, the effectiveness of machine learning techniques hinges on the quality of the training data. Data that is biased, obsolete, or inadequately represents the target population erodes the accuracy of the model’s predictions. The advantage of machine learning is that it can derive patterns from millions of observations. The model then uses this pattern recognition to train itself to learn to recognize patterns in data it hasn’t yet seen.
Benefits of Predictive Analytics

- Personalize the customer experience. Mobile payments, online transactions, and web analytics allow companies to capture troves of data about their customers. In return, customers expect businesses to understand their needs, form relevant interactions, and provide a seamless experience across all touchpoints. Needs forecasting is a popular predictive analytics tool, in which businesses anticipate customer needs based on inferences such as their web browsing habits. For example, retailers like Target are able to predict when a customer is expecting a baby and proactively market baby products to them. Meanwhile, recommendation engines use predictive analytics to guess what types of products you’ll like based on your previous consumption habits or stated preferences.
- Mitigate risk and fraud. Insurance companies and financial institutions use predictive analytics to determine a customer’s “risk” level when evaluating them for an insurance policy or a loan, for example. By aggregating internal customer data and personal data from third-party data brokers—such as an applicant’s credit score, criminal record, and employment history—these businesses use predictive analytics models to determine the likelihood that a loan applicant will default, or the probability that a person of advanced age with certain pre-existing conditions will require intense medical care in the future. Typically, the model generates a risk score, which is then used to determine things like the interest rate on a mortgage, what credit limit to place on a credit card, or how much to charge for a monthly insurance premium. The more “high-risk” an applicant is deemed, the higher their interest rate or premium, thereby helping to insulate the business from risk.
- Proactively address problems. Predictive analytics enables businesses to determine which customers are at risk of churn, which assets are likely to break down, and times of the year when demand will spike (or drop). By forecasting these events in advance, businesses can adopt a proactive rather than reactive approach to addressing problems, thereby minimizing their impact on the customer experience and the bottom line.
- Reduce the time and cost of forecasting business outcomes. Given enough historical data, predictive forecasting can save businesses from engaging in costly, time-consuming activities such as A/B testing, or allocating marketing resources to campaigns that may or may not generate leads. Obviously, the more historical data you feed into a model, the more accurately it can predict future outcomes, but simple linear regression models or decision trees, for example, don’t require datasets collected over a decades-long period in order to generate relatively accurate forecasts.
- Gain a competitive advantage. Businesses that use predictive analytics not only benefit from knowing what happened but why it happened. These are crucial steps to solving business problems and proactively addressing customer needs. Predictive analytics provides proactive insights on what to do next based on forecasts of the future. This can help businesses make better long-term strategic plans while reducing costs and risks. In day-to-day business operations, predictive analytics also helps with efficiency. For example, proper demand forecasting leads to better inventory management, reducing the likelihood of overstocking items or losing sales.
Since you’re here…
Interested in a career in data analytics? You will be after scanning this data analytics salary guide. When you’re serious about getting a job, look into our 40-hour Intro to Data Analytics Course for total beginners, or our mentor-led Data Analytics Bootcamp.


