If you’re a business owner and have ever wanted to predict the future, then you’re in luck. Time series forecasting essentially allows businesses to predict future outcomes by analyzing previous data, and providing businesses with a glimpse into what direction data are trending.
But time series forecasting is not without its challenges. To use time series forecasting, one must have accurate data from the past and have some assurance that this data will be representative of future events.
Curious to know whether time series forecasting is applicable to your business? Then you’re in luck. Below, we’ll detail everything you need to know about time series forecasting, so that you can decide whether or not time series forecasting is right for you and your business.
Time Series Forecasting: An Overview

What Is Time Series Forecasting?
Time series forecasting is a method of predicting future events by analyzing historical data. Some examples of this include:
- Annual crop yields
- Monthly sales performances
- Cryptocurrency transactions
When Should You Use Time Series Forecasting?
Time series forecasting can be used when you have quantitative data that has been measured over a period of time. For time series forecasting to work, you must ensure that several criteria are met.
Here’s an example that can help elucidate those criteria: Say you work for an online publication and your manager wants to understand how website traffic fluctuates over the weeks. To understand the importance of this project, you might ask your manager what action can be enabled from having that data. This brings me to the first and most important criterion to understand: what the business problem to solve is.
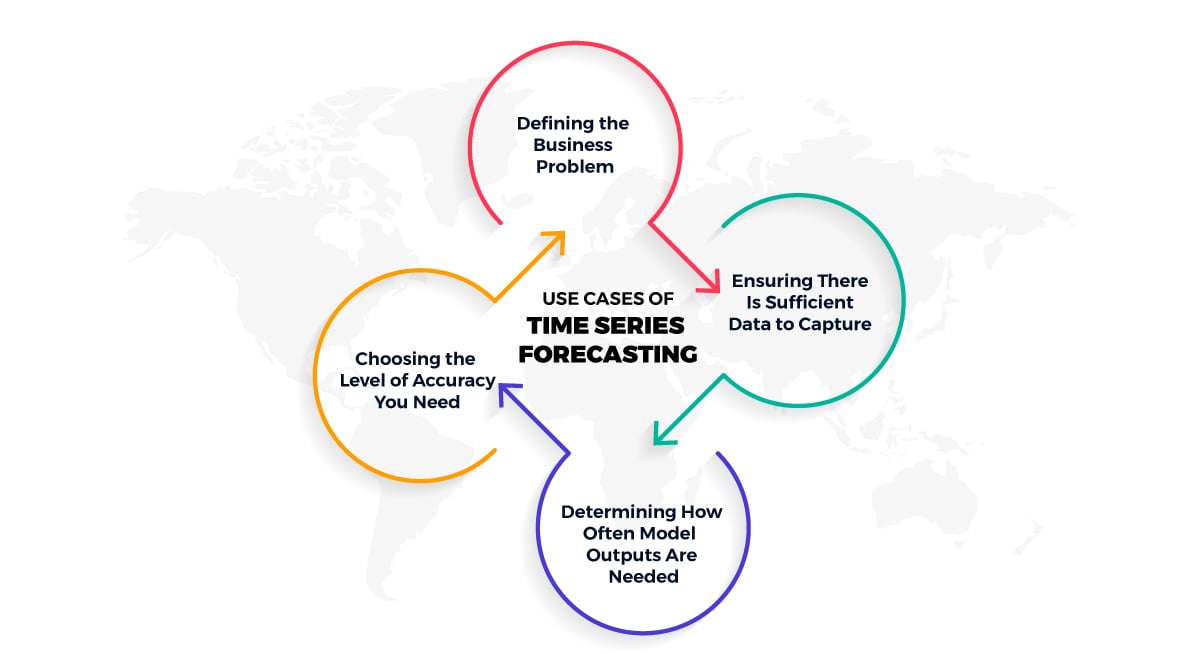
Defining the Business Problem

Let’s say you want to know if traffic will take a sharp decline or increase in the coming weeks. If the traffic seems like it will dip in the next couple of weeks, the business will want to inject more spend into its advertising. When the business problem is defined up front, it allows you to refer to it at any time so you can ensure you are working towards your objective.
Get To Know Other Data Science Students

Bryan Dickinson
Senior Marketing Analyst at REI

Sam Fisher
Data Science Engineer at Stratyfy

Aaron Pujanandez
Dir. Of Data Science And Analytics at Deep Labs
Ensuring There Is Sufficient Data to Capture

In order to begin answering the above question and understanding the business problem and possible solutions, you need to have the data necessary to perform the time series analysis. Generally speaking, the more data you have the better. Businesses often capture loads of data only to later decide what they are interested in asking of said data.
Choosing the Level of Accuracy You Need
Generally speaking, the further out you predict, the less accurate your prediction will be. Typically time series data are recorded in a timestamp format containing the year, month, day, hour, minute, second, and millisecond it occurred. You don’t need to worry about a lack of granularity, you simply have to choose one. From that starting point, your most accurate prediction will be one unit into the future. Whether that is one day, week, or month is up to the granularity you chose. In this web traffic example, your data should be weekly because you want to spend on ads if you predict a dip in the upcoming 1-2 weeks. The granularity you choose is informed by business needs and what actions need to be taken when.
Determining How Often Model Outputs Are Needed

Because the predictions are made at the weekly level and the action to be taken is to increase ad spend, it would make the most sense to run the model every 2 weeks predicting 1-2 weeks out. You’d have to check out what the predictions are, and, if web traffic is expected to drop below the threshold, you’d want to have the ad operations team increase ad spend to level out the dip in traffic. In a more advanced system, the outputs of the model could be run automatically to inform the inputs to ad spend models, once the performance of the model is determined to be high enough.
What Are Some Common Applications of Time Series Forecasting?
Predicting the Weather

This is a time series forecast analysis because you can take measurements of the climate around the area you are trying to predict the weather for. Examples of variables that would be useful in performing this analysis could include
- Air temperature
- Time of day
- Wind speed
- Wind direction
- Atmospheric pressure
These data captured at a minute-by-minute or hour-by-hour cadence over years could then show you both cyclical and seasonal patterns. Random variables like earthquakes can add white noise to this time series model.
Forecasting Stock Price Changes

A common time series forecasting problem is predicting stock price changes. This method is common, although it is difficult to predict accurately, so don’t expect this to be your big break! To perform the analysis you need stock prices for a particular stock over hours, days, or months to feed into the model.
Forecasting Web Traffic for an eCommerce Site

Forecasting web interactions on a website is within the purview of time series forecasting as well. You can get much more detailed in your approach by analyzing pageview counts on specific important web pages, and clickthrough rates on important buttons.
Time Series Forecasting Components

Now that we know how time series forecasting works, and have some common examples, let’s take a look at what you need to make that happen:
Level
In a set of time series data, the level is the average of its values over a particular period of time. For the purpose of creating a simple example, let’s say you had 10 days worth of daily sales data. If you were to average daily sales across those 10 days and saw that the average was $100, that would be the level of that data.
Seasonality
Within time series data, there are patterned fluctuations that occur on a regular cadence within a calendar year. For example, shifts in weather patterns due to the seasons mean there is seasonality in crop yield time series data for crops that prosper in certain conditions. If you plotted the sales of ice cream over the course of a year you would see a spike in the summer months. In the context of business, it is important to consider what seasonal effects might be relevant to your company’s product.
Trend
Trends are visible in data any time there is a long-term change, whether positive or negative, in said data. It’s important to note that a trend is defined as a general tendency in the direction of the data’s movement over the long term. This is in opposition to the definition of trends as being fleeting movements in style in say fashion or on social media. A simple example of a trend is the increase in the world population-it may fluctuate up and down over months or years but looking at the graph it is clear that over the long run there are more and more people living on Earth over time.
Cycles
Any recurring periodic movement in the data that exists at the scale of years—and not within a calendar year (as was the case with seasonality)—is considered to be a cyclical pattern. The pattern should not be fixed and should occur across years. If you look at the trendline, a cycle is a full period of that line. It’s sometimes referred to as the “business cycle,” which is comprised of the phases of four phases: prosperity, recession, depression, and recovery.
Irregularity (AKA White Noise)
In time series forecasting, the irregular term is random, unexplainable noise in the data that remains after isolating the above other components. This is not to be confused with time series data that are white noise, that is time series data that cannot be meaningfully used to make predictions because they are essentially too noisy to have any discernible patterns the model can be fit to.
Time Series Models
Here are some of the most common tools used to model time series forecasting:
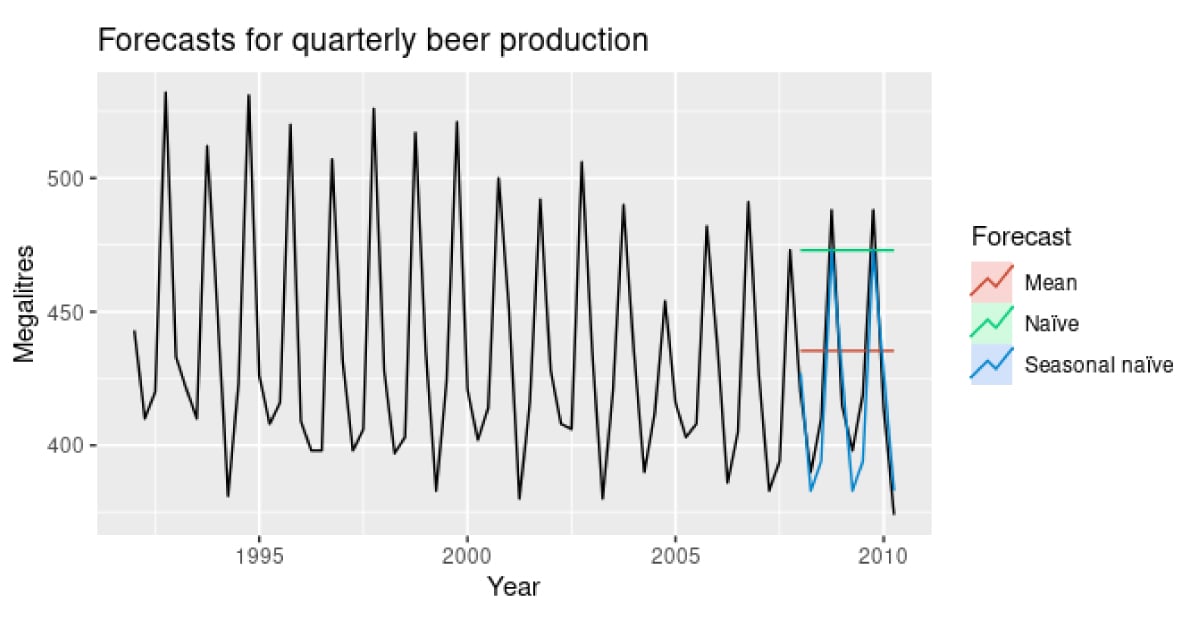
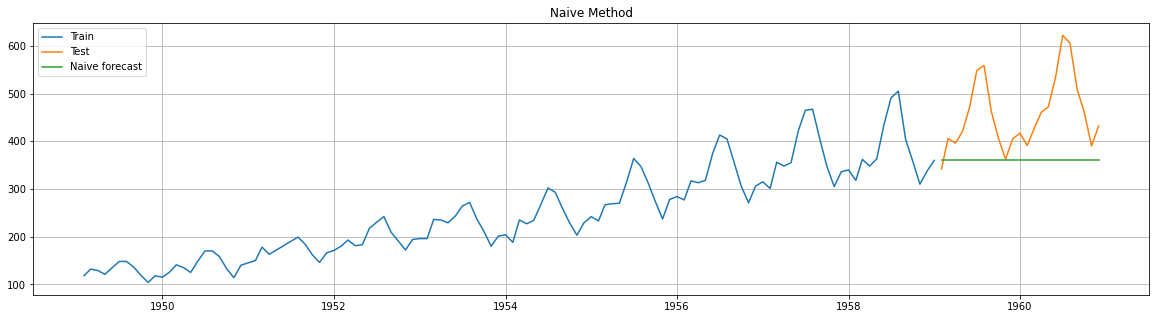
Naïve, SNaïve
In time series forecasting, Naïve models assume the next data point is the same as the last. So for example, if you have daily sales data, you would predict tomorrow’s sales based on today’s. You then move one data point further down the line (the day after tomorrow) and so on. Let’s take a look at another example to make this more clear: a dataset that shows the number of passengers on flights daily. If a day had 350 passengers, the Naïve model would say that the next day would have 350 passengers.
This is helpful context for understanding the difference between the Naïve and SNaïve models. The predictions in this model are based on the last observed data point. While the Naïve model assumes that the previously seen data point is the same as the following data point, the SNaïve model introduces seasonality as a component to the analysis, which produces a closer match to the data’s trends.
This simple inclusion of seasonality as a variable in the model can improve model performance. In the below example of orders of electrical equipment by month in the European region, the difference in the two models’ performance can be seen here:

Exponential Smoothing
The exponential smoothing forecasting method is a classic approach to the problem of forecasting data. It smoothes out the trend in your data and is calculated based on the previous data point. Say that you have weekly sales data and you want to predict the following week. A simple exponential smoothing formula that can produce a forecasted data point uses α (pronounced alpha) to denote how much smoothing you want to apply to your forecasted line. To get your forecast in this example, you would take the previous week’s actual sales data, multiply it by α, and then multiply the previous week’s forecast by 1 – α. You can see this in action in the below image taken from this YouTube which explains the process well if you are still having trouble imagining this process:

ARIMA, SARIMA
Another commonly used model is ARIMA, which stands for AutoRegressive Integrated Moving Average. In autoregression, past observations are linearly combined to produce the forecasts. Moving Average models forecast based on a linear combination of prior errors in the forecast. Thus the ARIMA model is the integration of these two approaches. The SARIMA model is the same as the ARIMA model with the addition of seasonality.
ARIMA models need to be fit to your data and utilize a train-test split of your data to learn the patterns in the data, enabling predictions. A train-test split is when you take the majority of your data (say 70%) for the model to learn patterns from, and test it against the remaining 30% to see how well it predicts those patterns. Let’s revisit the airline passengers dataset to make this clearer. As a recap, the airline passenger dataset has counts of passengers on flights daily. The ARIMA model gets fitted to the data using that function in whatever statistical package you use in your programming language.
Once the model is fit, predictions can be made on the data and plotted to visualize the result. You can see the results of fitting an ARIMA model onto the passenger’s dataset vs. the actual data in the image below:

There are many factors that go into figuring out which model is best able to forecast the data you are working with. It is common to choose one or more performance measuring metrics (for example Mean Absolute Error) to evaluate the performance of multiple models. The one with the lowest total error rate based on the metric you choose can tell you which model is best suited to your dataset.
Decomposition + Any Model
As you saw in the above explanations of models, there is a lot of isolation of variables going on in time series forecasting. It is necessary to understand trends, seasonality, cycles, and randomness to differentiate the influences in order to make better predictions. Decomposition is an additional layer you can add to any model to improve its performance in predicting future trends. But remember that it is important to try different models (with and without decomposition) and measure the performance of each model using the same success metric to find the one that works best for your data.
Time Series Forecasting FAQs
We’ve got answers to your most frequently asked questions.
What Is a Time Series Forecasting Model?
A time series forecasting model takes as inputs historical time series data. It then produces a forecasted trend based on those inputs.
What Is the Goal of Time Series Forecasting?
The ultimate goal of time series forecasting is to utilize historical data in order to understand future outcomes. The many uses of this include making better strategic business decisions, anticipating shifting trends and pivoting approaches based on that, and more.
What Is the Difference Between Time Series Analysis and Time Series Forecasting?
Simply put, time series analysis is the analysis of time series data in order to understand trends and patterns. The historical data points are fed into a time series forecasting model to predict the future outcome of those trends.
The two can happen simultaneously—as new data points are captured, these can be fed back into the model to continually improve its ability to create forecasts.
Since you’re here…
Curious about a career in data science? Experiment with our free data science learning path, or join our Data Science Bootcamp, where you’ll get your tuition back if you don’t land a job after graduating. We’re confident because our courses work – check out our student success stories to get inspired.