![87 Data Science Interview Questions [2022 Prep Guide]](https://www.springboard.com/blog/wp-content/uploads/2018/11/87-data-science-interview-questions-2022-prep-guide.png)
Interviewing for data science roles is a skill unto itself. Often, the candidates who land jobs are not the ones with the strongest technical skills, but rather, the ones who can combine that with interview savvy.
Although data science is a vast field, there are a few topics that tend to come up often in interviews. So we’ve compiled a list of the most common data science interview questions, along with the answers to them.
Data Science Technical Interview Questions
Supervised Learning vs. Unsupervised Learning: What’s the Difference?
Supervised and unsupervised learning systems differ in the nature of the training data that they’re given. Supervised learning requires labeled training data, whereas, in unsupervised learning, the system is provided with unlabeled data and discovers the trends that are present.
What Is Logistic Regression?
Logistic regression is a form of predictive analysis. It is used to find the relationships that exist between a dependent binary variable and one or more independent variables by employing a logistic regression equation.
What Is a Decision Tree?
Decision trees are a tool used to classify data and determine the possibility of defined outcomes in a system. The base of the tree is known as the root node. The root node branches out into decision nodes based on the various decisions that can be made at each stage. Decision nodes flow into lead nodes, which represent the consequence of each decision.
What Is Pruning in a Decision Tree Algorithm?
Pruning a decision tree is the process of eliminating non-critical subtrees so that the data under consideration is not overfitted. In pre-pruning, the tree is pruned as it is being constructed, following criteria like the Gini index or information gain metrics. Post-pruning entails pruning a tree from the bottom up after it has been constructed.
What Is Entropy in a Decision Tree Algorithm?
Entropy is a measure of the level of uncertainty or impurity that’s present in a dataset. For a dataset with N classes, the entropy is described by the following formula.

Explain K-Fold Cross-Validation.
Cross-validation is a technique used to estimate the efficacy of a machine learning model. The parameter, k, is a tally of the number of groups that a dataset can be split up into.
The process starts with the entire dataset being shuffled in a random manner. It is then divided into k groups, also known as folds. The following procedure is applied to each unique fold:
- Assign one fold as a test fold and the remaining k-1 folds as a test set.
- Begin training the model on the training set. For each cross-validation iteration, train a new model that’s independent of the models used in prior iterations.
- Validate the model on the test set and save the result of each iteration.
- Average out the results from each iteration to obtain the final score.
Explain the Random Forest Model. How Do You Build a Random Forest Model?
A random forest model is a machine learning algorithm and a form of supervised learning. It is used most commonly in regression and classification problems. Here are the steps to build a random forest model:
- From a dataset with k records, select n.
- Construct individual decision trees for each of the n data values under consideration. A predicted result is obtained from each of them.
- A voting algorithm is applied to each of the results.
- The prediction with the most votes is assigned as the final result.
What Is the Difference Between Univariate, Bivariate, and Multivariate Analysis?
Univariate analysis involves studying a single variable. Bivariate and multivariate analysis involve comparing two, or more than two variables, respectively.
Can You Avoid Overfitting Your Model? If Yes, Then How?

Yes, it is possible to overfit data models. The following techniques can be used for that purpose.
- Bring more data into the dataset being studied so that it becomes easier to parse the relationships between input and output variables.
- Use feature selection to identify key features or parameters to be studied.
- Employ regularization techniques, which reduce the amount of variance in the results that a data model produces.
- In rare cases, some noisy data is added to datasets to make them more stable. This is known as data augmentation.
What Feature Selection Methods Are Used To Select the Right Variables?
The following are some of the techniques used for feature selection in data analysis:
- Pearson’s Correlation
- Chi-Square
- Recursive Feature Elimination
- Backward Elimination
- Lasso Regression
- Ridge Regression
How Would You Approach a Dataset That’s Missing More Than 30 Percent of Its Values?
The approach will depend on the size of the dataset. If it is a large dataset, then the quickest method would be to simply remove the rows containing the missing values. Since the dataset is large, this won’t affect the ability of the model to produce results.
If the dataset is small, then it is not practical to simply eliminate the values. In that case, it is better to calculate the mean or mode of that particular feature and input that value where there are missing entries.
Another approach would be to use a machine learning algorithm to predict the missing values. This can yield accurate results unless there are entries with a very high variance from the rest of the dataset.
Explain Dimensionality Reduction and Its Benefits.
Dimensionality reduction is the process of eliminating the redundant variables or features being studied in a machine learning environment. The benefits of dimensionality reduction are:
- It reduces the storage requirements of machine learning projects.
- It’s easier to interpret the results of a machine learning model.
- It’s easier to visualize results when the dimensionality is reduced to two or three parameters, making 2D and 3D visualizations possible.
What Are the Steps Involved in Maintaining a Deployed Model?
The following measures should be taken to maintain data analysis models once they have been deployed:
- Train the model using new data values.
- Choose additional or different features on which to retrain the data.
- In instances where the model begins to produce inaccurate results, develop a new model.
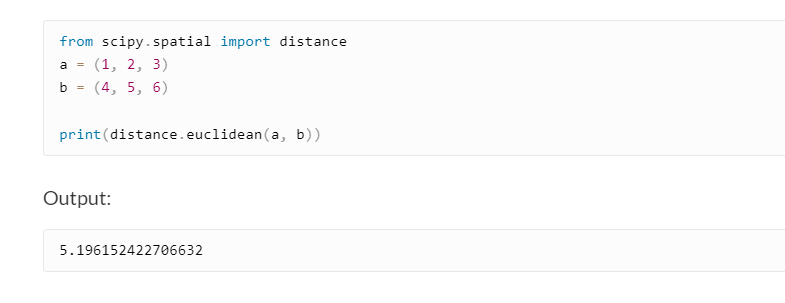
How Can You Calculate Euclidean Distance in Python?
There are multiple inbuilt modules and functions that you can use to calculate Euclidean distance in Python. That includes the NumPy module, math.dist() function, and distance.euclidean() function.
The following code shows how to use the distance.euclidean() function to calculate Euclidean distance.
Explain What a Recommender System Does.
A recommender system uses historical behavior to predict how a user will rate a specific item. For example, Netflix recommends TV shows and movies to users by analyzing the media that users have rated in the past, and using this to recommend new media that they might like.
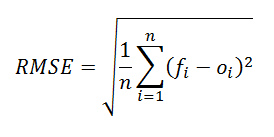
What Is the RMSE?
Root mean squared error (RMSE) is a metric that calculates the error in a numerical prediction. The following is the formula for RMSE.
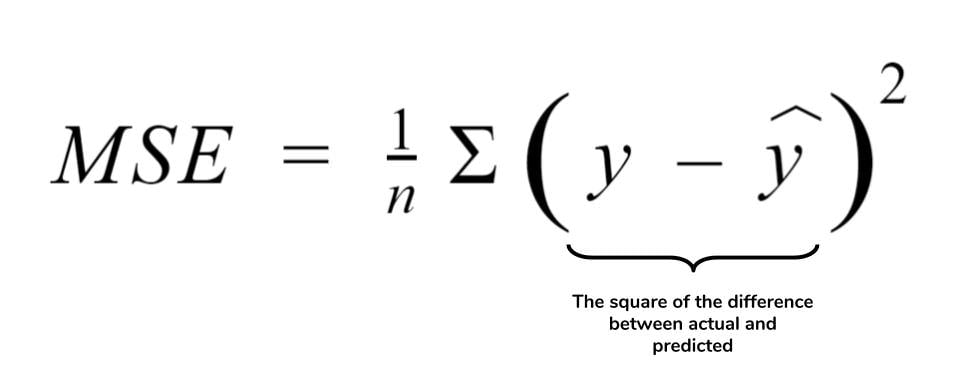
How Do You Calculate the MSE in a Linear Regression Model?
Mean squared error (MSE) is a measure of the degree of error that is present in a statistical model. It can be found with the following formula:
What Is K-Means Clustering?
K-means is an unsupervised learning algorithm used for problems having to do with clustering data. It follows the sequence of steps described below:
- Choose how many clusters to create and assign it as k.
- Choose k points from the dataset randomly, which will serve as the centroids.
- Take each data point and group it with the closest centroid. This will lead to the formation of k clusters.
- Calculate the variance in the dataset and assign a new centroid for each cluster accordingly.
- Now repeat the third step by reassigning each data point with the new centroids.
- If any reassignments have taken place, then repeat the fourth step. If not, the model is ready.
How Can You Select K for K-Means?
The most popular method for selecting k for the k-means algorithm is using the elbow method. To do this, you need to calculate the Within-Cluster-Sum of Squared Errors (WSS) for different k values. The WSS is described as the sum of the squares of the distance between each data value and its centroid.
You will then choose the value of k for which the WSS error starts to become negligible.
What Is a P-Value? What Is the Significance of P-Value?
P-value expresses the probability that an observation made about a dataset is a random chance. Any p-value under 5% is strong evidence supporting the observation and against the null hypothesis. The higher the p-value, the less likely that a result is valid.
What Is an Outlier?
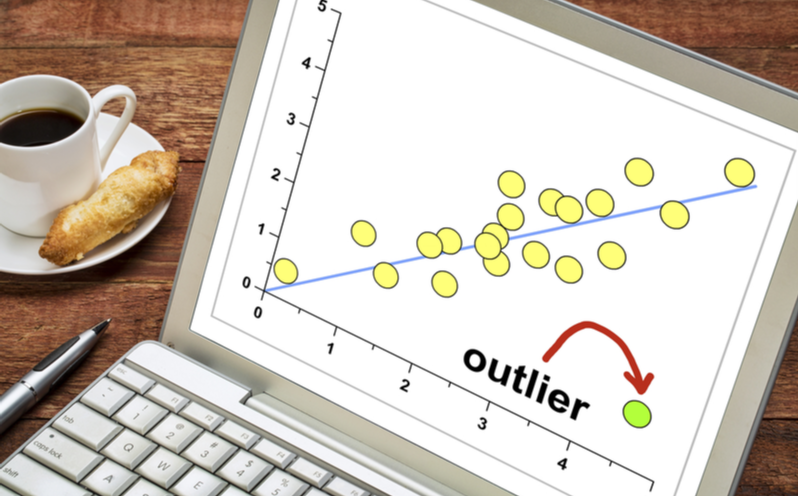
An outlier is a data value that lies at a great distance from the other values in a dataset. An outlier might be the result of an experimental error or a valid value that shows a high degree of variance from the mean.
How Do You Treat Outlier Values?
Outlets are often filtered out during data analysis if they don’t fit certain criteria. You can set up a filter in the data analysis tool you’re using to automatically eliminate outliers. However, there are instances where outliers can reveal insights about low-percentage possibilities. In that case, analysts might group outliers and study them separately.
Explain Normal Distribution
A normal distribution is a probability distribution where the values are symmetric on either side of the mean of the data. This implies that values closer to the mean are more common than values that are further away from it.
What Is Deep Learning?
Deep learning is a subset of machine learning concerned with supervised, unsupervised, and semi-supervised learning based on artificial neural networks.
What Is an RNN (Recurrent Neural Network)?
A recurrent neural network is a kind of artificial neural network where the connections between nodes are based on a time series. RNNs are the only form of neural network with internal memory and are often used for speech recognition applications.
Get To Know Other Data Science Students

Bret Marshall
Software Engineer at Growers Edge

Peter Liu
Business Intelligence Analyst at Indeed

Jonah Winninghoff
Statistician at Rochester Institute Of Technology
Explain the ROC Curve.
ROC curves are graphs that depict how a classification model performs at different classification thresholds. The graph is plotted with the True Positive Rate (TPR) on the y-axis and the False Positive Rate (FPR) on the x-axis.
The TPR is expressed as the ratio between the number of true positives and the sum of the number of true positives and false negatives. The FPR is the ratio between the number of false positives in a dataset and the sum of the number of false positives and true negatives.
What Is the Difference Between Data Modeling and Database Design?
A data model is a conceptual model showing the different entities from which data is sourced and the relationships between them. Database design, on the other hand, is the process of building a schema based on how a database is constructed.
Explain Time Series Analysis.

A time-series analysis is a form of data analysis that looks at data values collected in a particular sequence. It both studies the data collected over time and factors in the different points in time in which data was collected.
How Can Time-Series Data Be Declared As Stationery?
Time series data being declared stationary implies that the data being collected does not change over time. This may be because there are no time-based or seasonal trends in the data.
What Is a Confusion Matrix?
A confusion matrix is used to determine the efficacy of a classification algorithm. It is used because a classification algorithm isn’t accurate when there are more than two classes of data, or when there isn’t an even number of classes.
The process for creating a confusion matrix is as follows:
- Create a validation dataset for which you have certain expected values as outcomes.
- Predict the result for each row that is present in the dataset.
- Now count the number of correct and incorrect predictions for each class.
- Organize that data into a matrix so that each row represents a predicted class and each column an actual class.
- Fill the counts obtained from the third step into the table.
The matrix that results from this process is known as a confusion matrix.
How Do You Use a Confusion Matrix To Calculate Accuracy?
There are four terms to be aware of related to confusion matrices. They are:
True positives (TP): When a positive outcome was predicted, and the result came positive
True negatives (TN): What a negative outcome was predicted, and the result turned out negative
False positives (FP): When a positive outcome was predicted, but the result is negative
False negative (FN): When a negative outcome was predicted, but the result is positive
The accuracy of a model can be calculated using a confusion matrix using the formula:
Accuracy = TP + TN / TP + TN + FP + FN
Write the Equations for Precision and Recall Rate.
The precision of a model is given by:
Precision = True Positives / (True Positives + False Positives)
The recall rate for a model is given by:
Recall = True Positives / (True Positives + False Negatives)
A recall rate of 1 implies full recall, and that of 0 means that there is no recall.
What Is the Use of the Summary Function?

Summary functions summarize the results of different model-fitting functions. In R, for example, the summary() function can be used to gather a quick overview of your dataset and the results that are produced by a machine learning algorithm.
How Do You Differentiate Between an Error and a Residual Error?
Error is a measure of the extent to which an observed value deviates from a true value. Residual error, on the other hand, expresses how much an observed value differs from the estimated value of a particular data point.
“People Who Bought This Also Bought…” or “You May Also Like…” Recommendations Seen on Amazon Are a Result of Which Algorithm?
Those recommendations are produced using item-based collaborative filtering algorithms.
What Is an SQL Query? Write a Basic SQL Query That Lists All Orders With Customer Information.
An SQL query is a request that returns a particular kind of data from a database. For example, let’s say you want to write an SQL that lists all the orders currently in a database along with information on the customers who made those orders. The SQL query for that request would look as follows:
SELECT
Orders.CustomerID, Orders.RequiredDate, Orders.ShipVia, Orders.ShipPostalCode, Customers.Address, Customers.Region, Customers.CompanyName
FROM
Customers
This query takes data from a table called “Customers.” It returns entries with information on the customer’s identification number, address, region, company name, postal code, and shipping details.
To help you prepare, we have compiled a post with the 105 most asked SQL interview questions and their answers.
K-Means Clustering vs. Linear Regression vs. K-NN (K-Nearest Neighbor) vs. Decision Trees: Which Machine Learning Algorithms Can Be Used for Inputting Missing Values of Both Categorical and Continuous Variables?
K-NN algorithms work best when it comes to inputting values in categorical and continuous data.
Are Data Science and Machine Learning Related to Each Other?

Data science and machine learning are closely related, and many machine learning algorithms are used in data science. Data science is the extraction of useful insights from large volumes of data. Machine learning is the process of training algorithms to derive automated insights.
Explain Ensemble Learning.
Ensemble learning is a machine learning practice in which multiple models are used to improve the predictive performance of a data analysis model.
What Do You Mean by Bagging?
Bagging is an ensemble learning technique used to reduce the amount of variance in a noisy dataset.
Explain Boosting in Data Science.
Boosting is an ensemble learning technique used to strengthen a weak learning model.
Explain Naive Bayes.
Naive Bayes is a classification algorithm that works on the assumption that every feature under consideration is independent. It is called naive because of that very same assumption, which is often unrealistic for data in the real world. However, it does tend to work well to solve a large range of problems.
Which Is Better for Text Analytics—Python or R?

Both Python and R can be used to analyze text. R comes with several in-built libraries for text analysis, as does Python.
Their differences come down to the nature of the data being studied. Python is better when working with huge volumes of data. R has better support for unstructured data.
What Is an SVM in Data Science?
SVMS—or support vector machines—are used for predictive or classification tasks. They employ what are known as hyperplanes to differentiate two different variable classes. Polynomial kernels, Gaussian kernels, and Sigmoid kernels are some of the kernels used in SVM.
Basic Data Science Interview Questions
What Is Data Science?
Data science is the process of using various mathematical and computational techniques to extract meaningful insights from datasets.
Data Science vs. Data Analytics: What’s the Difference?
Data science uses insights extracted from data to solve specific business problems. Data analytics is a more exploratory practice of unearthing the correlations and patterns that exist in a dataset.
Why Did You Opt for a Data Science Career?
Tell them how you got passionate about data science. You can share a quick story or talk about a specific area that served as your gateways to data science, such as statistical analysis or Python programming.
Then, talk about your background—your college degree, previous companies you’ve worked at, and data science courses that you’ve completed.
Finally, relate your interests to the organization’s needs, and explain how your expertise in data science can help the company solve its challenges.
Related Read: 30 Statistics Interview Questions to Prep For Your Interview
What Is a Statistical Interaction?
A statistical interaction is when two or more variables interact, and this results in a third variable being affected.
Explain Linear Regression.
Linear regression is a tool for quick predictive analysis. For example, the price of a house depends on a myriad of factors, including its size and location. In order to see the relationship between these variables, you can build a linear regression, which predicts the line of best fit and can help conclude whether or not these two factors have a positive or negative relationship.
What Are the Assumptions Required for a Linear Regression?
There are four major assumptions.
1. There is a linear relationship between the dependent variables and the regressors, meaning the model you are creating actually fits the data.
2. The errors or residuals of the data are normally distributed and independent from each other. 3. There is minimal multicollinearity between explanatory variables
4. Homoscedasticity—the variance around the regression line—is the same for all values of the predictor variable.
What Do You Understand About the True-Positive Rate and False-Positive Rate?

The true-positive rate (TPR) is the ratio between the number of true positives (TP) and the sum of the number of true positives and false negatives (FN). The false positive rate (FPR) is the ratio between the number of false positives and the sum of the number of false positives and true negatives.
TPR = TP/TP+FN
FPR = FP/FP+TN
Can You Differentiate Between Long-Format Data and Wide-Format Data?
These are two different ways in which a dataset can be written. Long-format data implies that data values in the first column do repeat. Wide-format means that there are no values that repeat in the first column.
In Data Science, Why Is Python Used for Data Cleaning?
Python is used for data cleaning because it includes libraries like NumPy and Pandas, which make it simple to eliminate inaccurate data values.
Explain Data Visualization.
Data visualization is the process of converting numerical and textual data insights into a visual format. Graphs, charts, tables, and other aids are used to make data visualization possible.
Why Is R Used in Data Visualization?
R has a wide offering of packages for data visualization. These require a minimal amount of coding, which is why R is a popular language for data visualizations.
List Some Popular Libraries Used in Data Science.
TensorFlow, Matplotlib, Keras, SciPy, and PyTorch are popular libraries used in data science.
What Is Variance in Data Science?
Variance is the distance between a value in a dataset and the mean value.
Explain Feature Vectors.
A feature vector describes the features of an object under consideration.
Explain Root Cause Analysis.
Root cause analysis is the process of using data to discover the underlying patterns driving a certain change.
What Is Logistic Regression?
Logistic regression is a form of regression analysis. It is used to establish the correlation between a dependent binary variable and one or many independent variables. Logistic regression is used as a predictive analytical tool.
What Is an Example of a Data Set With a Non-Gaussian Distribution?
An example of this would be the distribution of height in a population.
What Is Cross-Validation?

Cross-validation is a technique that demonstrates the efficacy of a machine learning model when analyzing unseen data. It tells us whether the model performs as well on test data as it did on training data.
What Is Collaborative Filtering?
Collaborative filtering is a form of content filtering that uses similarities between different users to make recommendations
Why Is A/B Testing Conducted?
A/B testing gives businesses the ability to peek into customers’ minds and get an idea of their preferences. You can quantify the amount of interest that different offerings garner in test groups, which lets you go to market with the final product with confidence.
What Is a Linear Regression Model? List Its Drawbacks.
A linear regression model is a model in which there is a linear relationship between the dependent and independent variables.
Here are the drawbacks of linear regression:
- Only the mean of the dependent variable is taken into consideration.
- It assumes that the data is independent.
- The method is sensitive to outlier data values.
What Is the Law of Large Numbers?
This law of probability states that, to get close to an expected result, you should run an experiment a large number of times, each independent of the other, and then average out the result.
Explain Confounding Variables.
When trying to investigate the relationship between a cause and its purported effect, you might encounter a third variable that impacts both the cause and the effect. This is known as a confounding variable.
Do Gradient Descent Methods Always Converge to the Same Point? Why or Why Not?
They don’t. This is because, in some cases, they settle on the locally optimal point rather than a global minima.
What Is a Star Schema?
A star schema is a way of structuring a database that stores measured data in a single fact table. It is called a star schema because the main table sits at the center of a logical diagram, and the smaller tables branch off like the nodes in a star.
Why Must You Update an Algorithm Regularly? How Frequently Should You Update It?

It is important to keep tweaking your machine learning algorithms regularly. The frequency with which you update them will depend on the business use case. For example, fraud detection algorithms need to be updated regularly. But if you need to study manufacturing data using machine learning, then those models need to be updated much less regularly.
What Are an Eigenvalue and an Eigenvector?
An eigenvector produces another vector in the same direction, but with an increased magnitude. The degree to which the eigenvector becomes scaled up is determined by a metric known as the eigenvalue.
Why Is Sampling Conducted?
Sampling is a statistical technique where a representative subset of a larger dataset is analyzed to infer trends.
Mention Some Techniques Used for Sampling. What Is the Main Advantage of Sampling?
The following are commonly used sampling techniques:
- Simple Random Sampling
- Systematic Sampling
- Cluster Sampling
- Purposive Sampling
- Quota Sampling
- Convenience Sampling
Sampling is more cost- and time-efficient than studying a full dataset. It lets you analyze a subset of that data, which is easier while providing insights into the whole dataset.
What Is Bias in Data Science?
The bias present in a data science model is described by the difference between the predicted value that it produces and a target value obtained from training data.
Explain Selection Bias.
Selection bias occurs when the sample data extracted from a larger dataset isn’t fully representative. This leads to faulty conclusions being made about the dataset.
What Is Survivorship Bias?
Survivorship bias occurs when there is too much focus placed on data that survived a particular selection process, while ignoring the data that did not survive it.
How Do You Work Towards a Random Forest?
The following algorithm is used to construct a random forest:
- Choose random samples from a dataset.
- Construct a decision tree for each data value in the sample and obtain the predicted result.
- Carry out a vote on each of the predicted results.
- The result with the highest votes is the final prediction of the model.
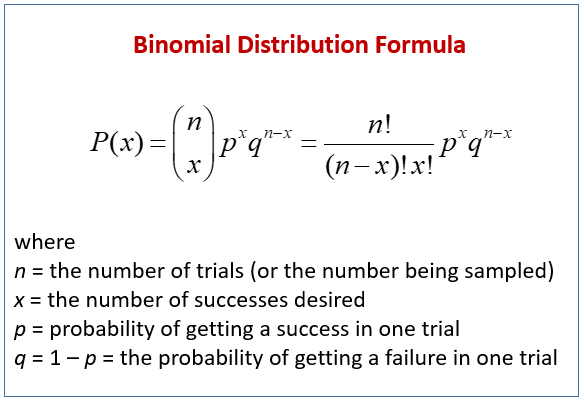
What Is the Binomial Probability Formula?
Binomial probability measures the number of successes that will occur when a certain number of trials is conducted. It is given by the following formula:
What Is the Difference Between a Type I and Type II Error?
A type I error is a false positive, which means that a positive result was predicted, but the result is negative. A type II error is a false negative, which means that a negative result was predicted, but the actual result is positive.
Data Science Interview Questions & Answers [General]

Introduce Yourself.
This is an opportunity to tell interviewers about your background and how got you interested in data science. You can describe notable moments in your data science career, like personal projects or awards, to make an impact on interviewers.
What Do You Know About Data Science?
This might seem like an invitation to talk about everything you know about data science, but it isn’t. Rather, recruiters want to know whether you understand the foundations of the discipline and how it fits into a business context.
Start by defining data science. Describe why it has gained importance as a field and how businesses can benefit from it. If possible, tailor this answer to the company where you’re interviewing and explain how data science can be used to solve the types of questions they want answers to.
Why Did You Opt for a Data Science Career?
Recruiters ask this question to gauge whether candidates are genuinely passionate about data science.
Your personal story is a powerful tool here. Be genuine about your interest in data science. Do you enjoy it because you love programming for data analysis? Or did you fall in love with it when you decided to take a data science course on a whim? Be honest about your journey and emphasize anything that illustrates your passion for the field.
What Is the Most Challenging Project You Encountered on Your Learning Journey?
Start by describing the project that you were working on. What problem were you trying to solve, and how did you translate it into requirements for a data analysis project? Then describe your process and how you solved the problems that you faced along the way. Focus on your problem-solving approaches and how you did the research required to overcome the challenges you faced.
Situational question based on the resume.
If you have a gap in your resume, recruiters will often ask about it. There’s no need to panic. Just be honest about why you took a professional break, and explain how you’ve gotten reacquainted with the industry.
Candidates without an academic background in computer science or math might get asked why they didn’t pursue those fields. Answer this question by explaining why you chose an unconventional route.
Further reading: here is a guide with data science interview preparation tips to know what to expect from your data science interview
Data Science Interview FAQs
Is Data Science Hard To Learn?
No. Anyone with the desire and commitment can learn data science. There are plenty of resources for beginners, and there are also courses and bootcamps where you can study data science. The math you’ll need as a beginner is quite foundational.
Is Data Science a Good Career?
Yes. There is a huge demand for data scientists in various industries, and salaries have also grown commensurately. Data science can also give you the opportunity to contribute to your company in meaningful ways.
How Long Does It Take To Transition Into Data Science?
If you have a background in math or computer science, then you can transition into data science easily. But if you don’t have this background, then you should give yourself at least six months to get familiar with the math and coding skills that are required.
If an Interviewer Asks, “Why Should We Hire You as a Data Scientist?” Then How Should You Answer?
Explain what makes you a skilled data scientist by describing the different data analysis approaches and tools you’re familiar with. Then, talk about the needs of the company and how you can help solve its most pressing challenges by leveraging those skills.
Since you’re here…Are you interested in this career track? Investigate with our free guide to what a data professional actually does. When you’re ready to build a CV that will make hiring managers melt, join our Data Science Bootcamp which will help you land a job or your tuition back!