Scikit-Learn is a machine learning library that includes many supervised and unsupervised learning algorithms. To date, Scikit-Learn is the first stop for most data scientists and machine learning engineers to build their first machine learning model or set a benchmark for further experiments. This is handy because you don’t always need complex and computationally expensive deep learning algorithms to model your data.
In this article, we will focus on logistic regression and its implementation on the MNIST dataset using Scikit-Learn, a free software machine learning library for Python.
What is Scikit-Learn logistic regression used for?
There are two primary problems in supervised machine learning: regression and classification (just to let you know almost 70% problems in data science are classification problems). Logistic regression (the term logistic regression is a “fake friend” because it does not refer to regression) is a classification algorithm used for classification problems, such as determining whether a tumor is malignant or benign and assessing automotive types. It is essential for an ML engineers or Data Scientists to have a clear understanding on logistic regression.
In simple terms, logistic regression is the process of finding the best possible plane (decision boundary, Figure 1) that separates classes under consideration. It also assumes that these classes are linearly separable.
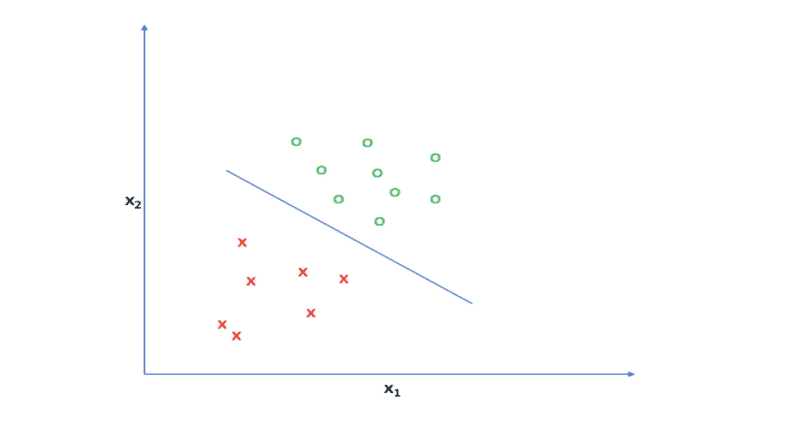
Figure 1: Sample decision plane in 2D (Source: jeremyjordan.me)
Since linear regression is a fundamental building block of machine learning, we’ll use this concept as a jumping-off point to explain the mathematics of logistic regression.
The main difference between linear regression and logistic regression is the output function. Linear regression uses a linear function that outputs continuous values in any range, whereas logistic regression uses a sigmoid function that limits outputs in the range of zero to one.
Get To Know Other Data Science Students
Leoman Momoh
Senior Data Engineer at Enterprise Products
Jonathan King
Sr. Healthcare Analyst at IBM
Melanie Hanna
Data Scientist at Farmer's Fridge
- Sigmoid function or logistic function
Mathematically, the sigmoid function can be described as:
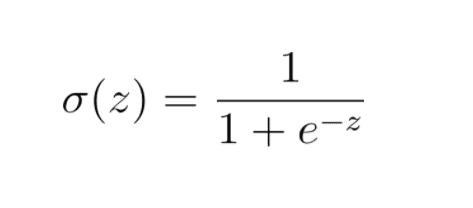
This limits the value of output in the range of zero to one, as shown in Figure 1.
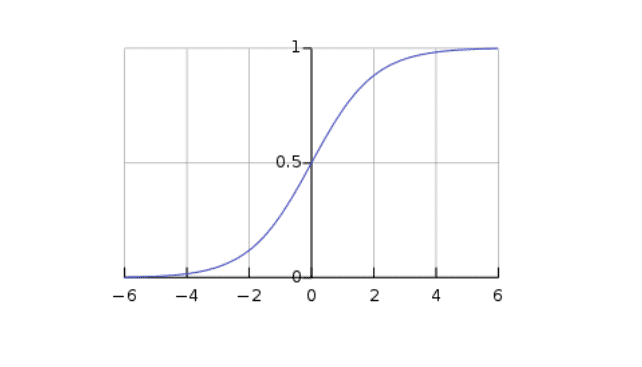
Figure 2: Sigmoid function. (Source: Wikipedia)
- Hypothesis
For linear regression hypothesis function can be written as:

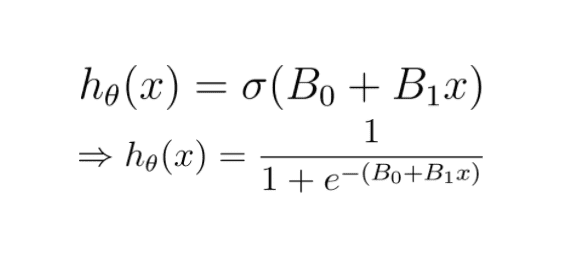
Which is a simple linear function (straight line). This function can be modified for logistic regression as:

Hence:

- Cost function
In simple terms, the cost function measures the performance of any given machine learning model with respect to data under consideration. This cost function is used to optimize the parameters of the machine learning model after each iteration, during the training phase, to get more accurate predictions.
The cost function for logistic regression is given by:

This can be further simplified to:

This cost function is also known as negative log-likelihood loss or cross-entropy loss.
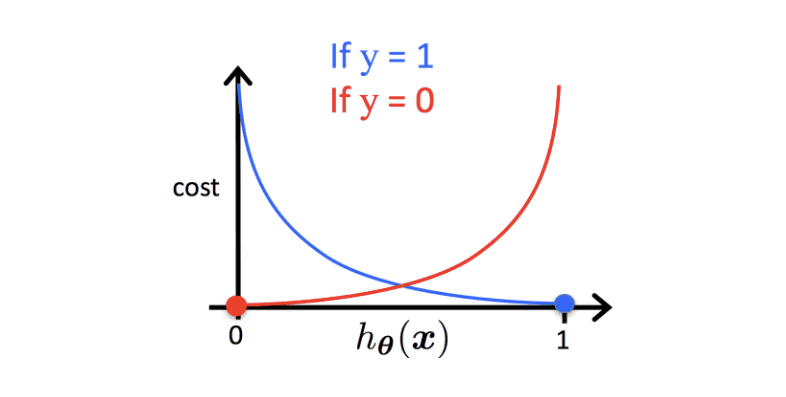
Figure 3: Cost function (Source: Researchgate)
Figure 2 depicts the cost function. When “y” is one and “h” is zero (blue line), the cost function will be high, thus severely penalizing the machine learning model. When “y” is one and “h” is also one (blue line), then the cost function will be zero, meaning no penalty for making correct predictions. Similarly, when “y” is zero and “h” is one (red line), the penalty will be high, whereas when “y” is zero and “h” is also zero, the penalty will be zero.
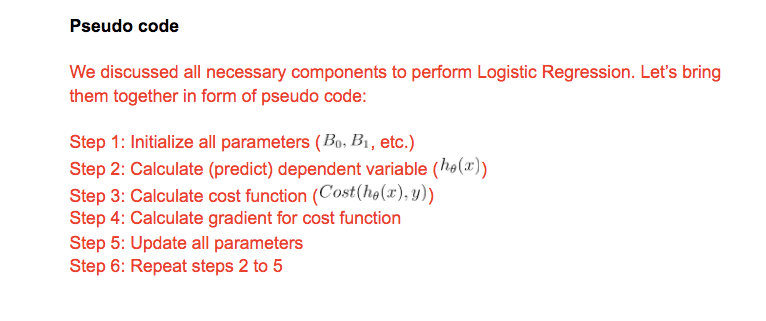
Implementing logistic regression on the MNIST dataset
In this section, we will implement logistic regression on the MNIST dataset. The MNIST dataset is a well-known benchmark dataset in the machine learning community. This dataset consists of pictures of handwritten digits with labels. All images are squares sized 28 x 28 pixels. The label ranges from zero to nine. This is a multinomial logistic regression problem.
By default, Scikit-learn takes care of the implementation, whether it’s a binary or multinomial problem depending on the number of labels present in the dataset.
The code for implementing logistic regression with Scikit-learn on MNIST dataset can be found here. This includes a detailed implementation of the logistic regression model with Scikit-learn.
Since you’re here…
Curious about a career in data science? Experiment with our free data science learning path, or join our Data Science Bootcamp, where you’ll get your tuition back if you don’t land a job after graduating. We’re confident because our courses work – check out our student success stories to get inspired.


