Shubhankar Jain, a machine learning engineer at SurveyMonkey, recently visited the Springboard office to talk about the machine learning engineering role, what an ML engineer does during a typical day, and how aspiring ML engineers can set themselves up for success.
Here’s what he had to say (you can find the full video below as well):
What is machine learning engineering?
Machine learning engineering is the process of using software engineering principles, and analytical and data science knowledge, and combining both of those in order to take an ML model that’s created and making it available for use by the product or the consumers.
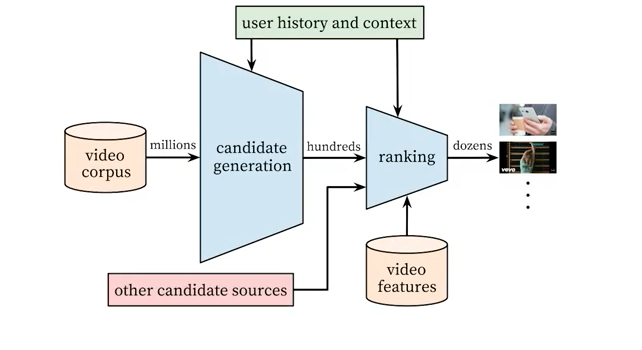
For example, a YouTube ML engineer might be in charge of developing the next-generation YouTube recommendation algorithm and then developing an ML pipeline around it and integrating it into YouTube such that you, the user, can end up clicking that “next” button to go see that next recommended video.
What does an ML engineer Do?
Day to day, I work with a variety of people as an ML engineer. I might work with a data scientist, a software engineer, a data engineer, and a UI/UX person all in one day.
In terms of different projects I take on, they usually are split 50/50: either investing or developing in our ML platform that’s used at SurveyMonkey, and then, on the other hand, assisting and working on further developing our machine learning models at SurveyMonkey.
For example, we recently were able to grow our ML platform capabilities by allowing our models to be automatically retrained.
Get To Know Other Data Science Students

Brandon Beidel
Senior Data Scientist at Red Ventures

Aaron Pujanandez
Dir. Of Data Science And Analytics at Deep Labs

Melanie Hanna
Data Scientist at Farmer's Fridge
Which ML project has been your favorite?
One of my favorite machine learning projects that I worked on was to develop an ML system for a credit union in the area. As part of that project, we wanted to be able to predict which of our users were most likely to open up a credit card account with the credit union.
It was really interesting to deal with financial data since it was a little bit different from the work I had done previously. But it was really enjoyable because it was providing a lot of great value for the credit union directly, and actually also helping their members, who might have benefited from opening a credit card account that they wouldn’t have known to [open] otherwise.

How did you become an ML engineer?
In my undergrad, I had studied computer science with a specialization in machine learning and data systems, where I was really able to learn the foundations of what goes into machine learning. But I really hadn’t utilized that in a professional setting yet.
My first job out of college was to work as a data engineer at a really small startup called AirPR. As a data engineer, I was in charge of the data pipelines and in data ingestion and flow throughout our entire product. But since we were such a small company of about 25 people, I ended up taking on a lot of different projects that related to ML models and software engineering work.
As a result, I gained a lot of experience in these three domains, and actually those three domains, and that experience in them, has allowed me to become an even better ML engineer today.
From there, I ended up working at SurveyMonkey as an ML engineer, leveraging the experience and expertise that I have and all of those three areas.
How do I become an ML engineer?
If you want to become an ML engineer, I highly recommend taking a data science model that you might’ve built as part of a Kaggle project or a project at school or any sort of course, really, and trying to turn that into a fully-fledged web app. As part of that process, you’ll end up implementing a lot of the day to day work that an ML engineer does and that kind of side project will really boost your resume and allow you to showcase to prospective employers that you’re fit to be an ML engineer.
I also highly recommend checking out the machine learning crash course that Google offers along with the Tensorflow resources that they provide. A highly competitive framework to that is also PyTorch, that also offers a lot of resources that deal with machine learning and machine learning engineering.
For more machine learning career information, check out these resources:
Since you’re here…Are you interested in this career track? Investigate with our free guide to what a data professional actually does. When you’re ready to build a CV that will make hiring managers melt, join our Data Science Bootcamp which will help you land a job or your tuition back!