
Free Data Analytics Course
Jumpstart your journey with 25 essential learning units in data analytics. No cost, just knowledge.
As companies increasingly rely upon the field of data science to unearth actionable insights, quantitative data is likewise becoming increasingly important. In both academics and in a range of industries, the broad applications of AI-based systems and machine learning algorithms have expanded the already crucial role that quantitative data plays. There’s so much data to be analyzed that it’s been estimated that more data points have been generated in the past couple of years than the number of observable stars.
With so many emerging technologies relying on the collection and analysis of quantitative data, a strong understanding of what quantitative data is and what purpose it serves is one of the most coveted skills on the job market.
That’s why we’ve created this guide. Below, we’ll detail everything you need to know about quantitative data and how it’s used.
What Is Quantitative Data?

Quantitative data is any data that has numerical properties. One of the most important functions of quantitative data is to answer questions like “how often,” or “how many.” The only way to answer these questions is to collect data that is quantifiable, meaning it can be measured.
Why Does Quantitative Data Matter?
Quantitative data has become increasingly important because of the high demand for the predictions that it can produce. From medical to manufacturing, every company, government, and an ever-increasing number of individuals relies on some form of quantitative data regularly.
Quantitative Data Examples
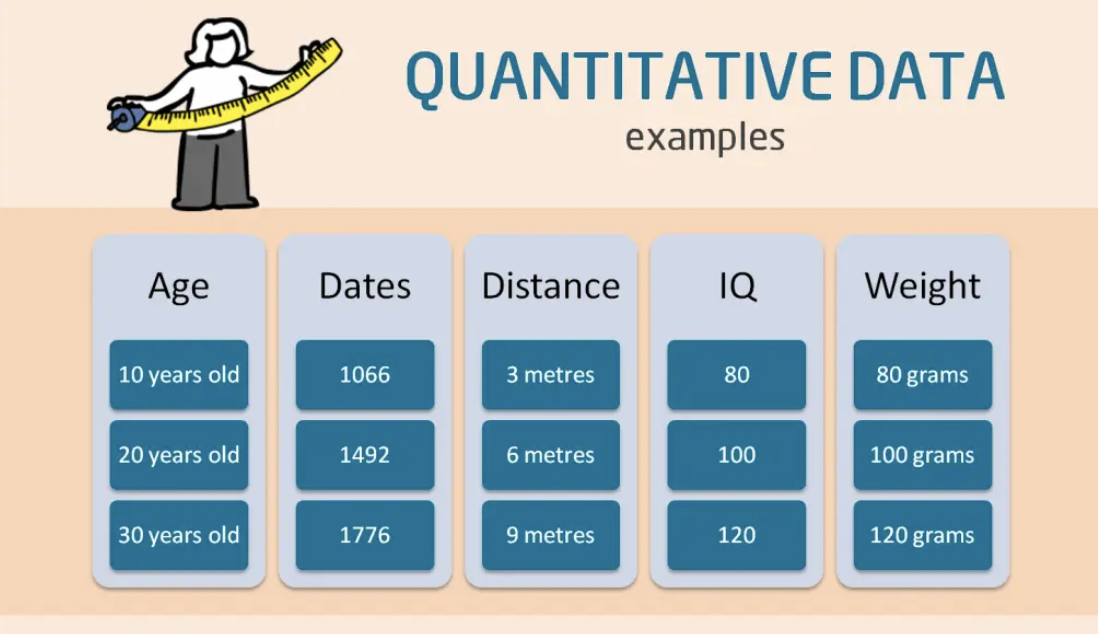
You probably see examples of quantitative data every day. Here are just a few examples of quantitative data:
- Inches of rain per year
- Someone’s height, weight, or age
- Number of days in a week, month, or year
- Temperatures
- Test scores
What Are the Types of Quantitative Data?
Quantitative data is divided into two categories: discrete and continuous. While it can be easy to visualize to understand what falls under the category of quantitative, the difference between discrete data and continuous data is a little more complicated. The best way to understand this difference is to think of discrete data as being countable and continuous data as being measured.
Discrete Data
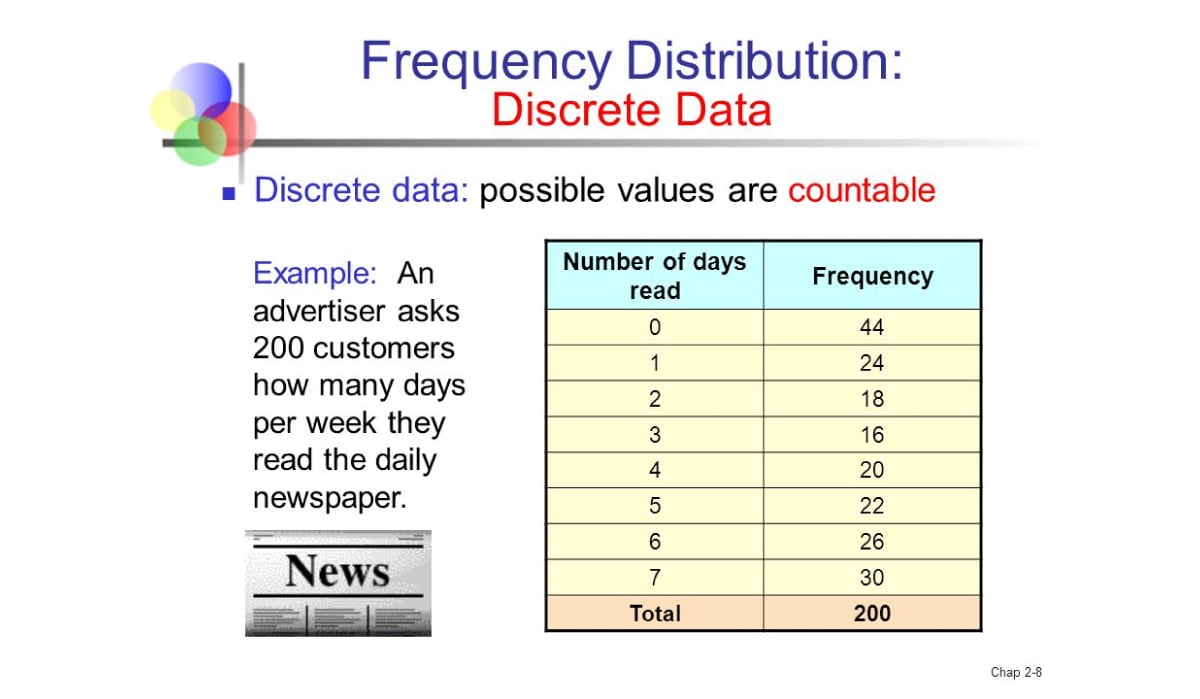
While all countable data is quantitative, not all quantitative data is countable. Discrete data is counted data. What this means is that each countable data point is not only quantitative, but also discrete. Below are some examples of countable data.
- 10,000 views on a webpage
- 2,000,000 votes in an election
- 100 likes on Instagram
Continuous Data
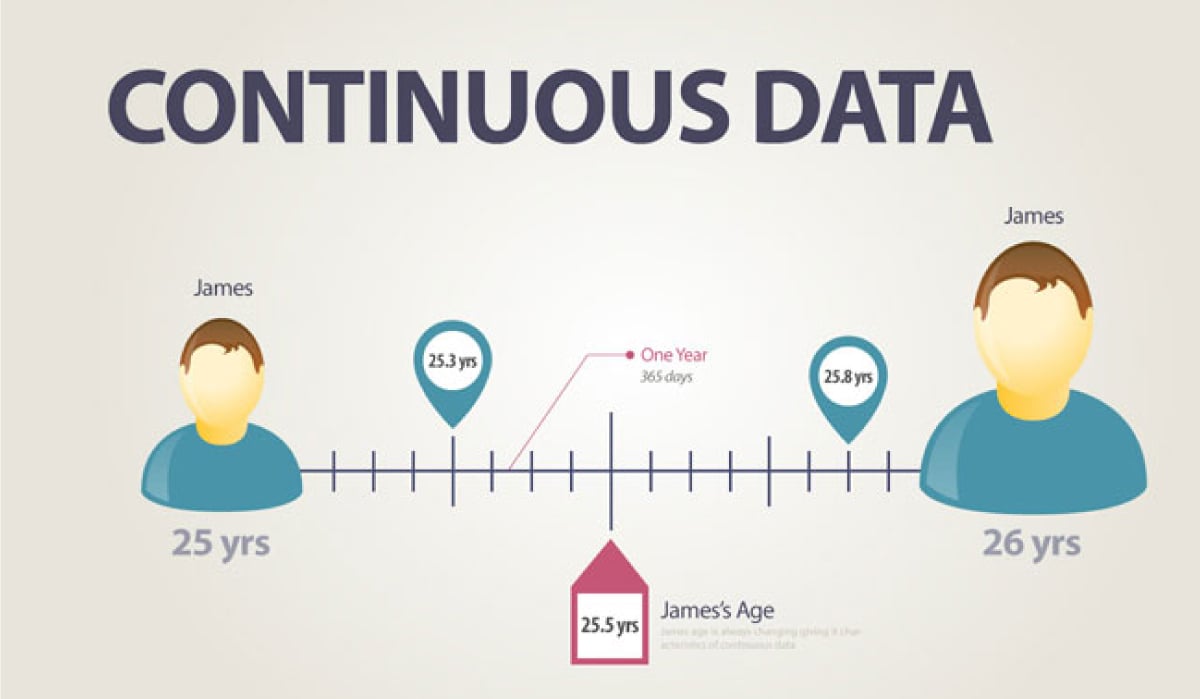
Wind speeds from a previous storm or the weight of the world’s largest pumpkin would be examples of data that is continuous. Continuous data can have decimals and can represent non-countable things. Using similar subjects to the discrete data above, you can see how the continuous data differs in what it measures and describes.
- Person’s age throughout a year
- 1.14 minutes spent on a webpage
- Average age of voters: 35–50 years
- Instagram reel length ranging from 30–45 seconds
Get To Know Other Data Analytics Students

Reagan Tatsch
Data Operations Manager at ISS

Gilles Ngomeni
Sales Analyst at Medline Industries

Joel Antolijao
Data Analyst at FanDuel
Quantitative Data Use-Cases
Quantitative data is used to make predictions, solve problems, and optimize processes and systems. Here are a few examples of what that looks like in action:
Mathematics
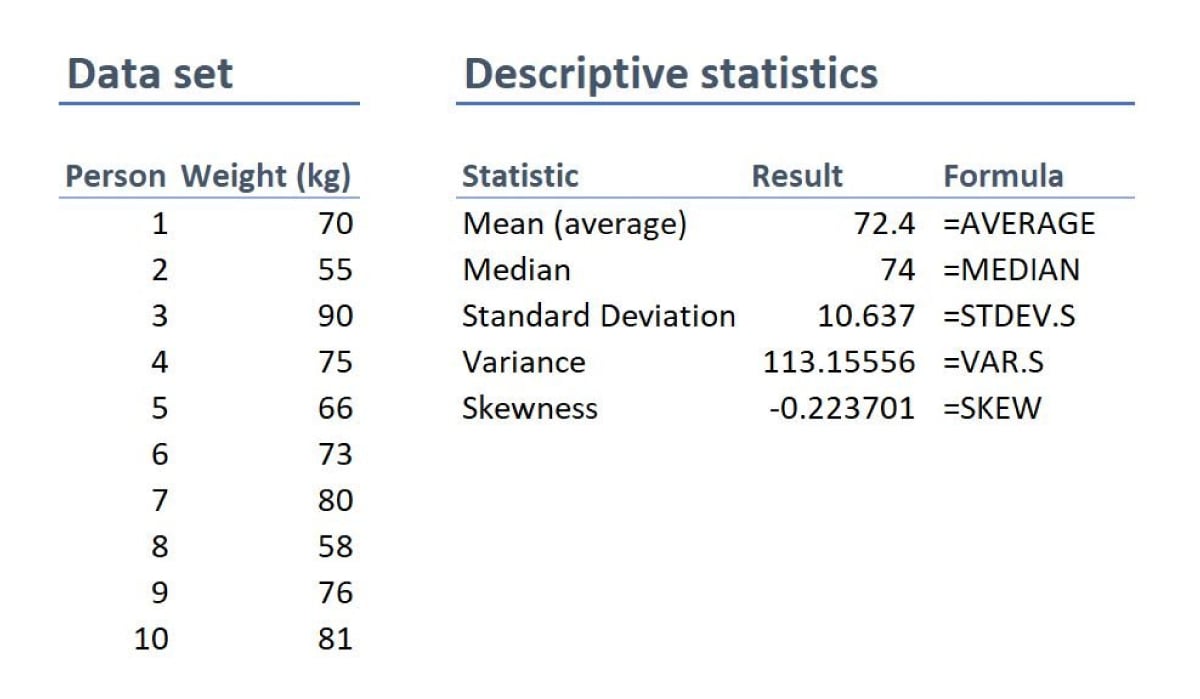
Mathematics heavily relies on quantitative data. Engineers and applied mathematicians have developed methods for medical research, biological research, and industrial processes, all through quantitative data analysis. For example, the mathematical usage of quantitative data could be a statistician working with a large data set to determine the weight variation for a set of people and whether or not there was a correlation between two different medical conditions. These are a few problems that could only be determined through quantitative data analysis.
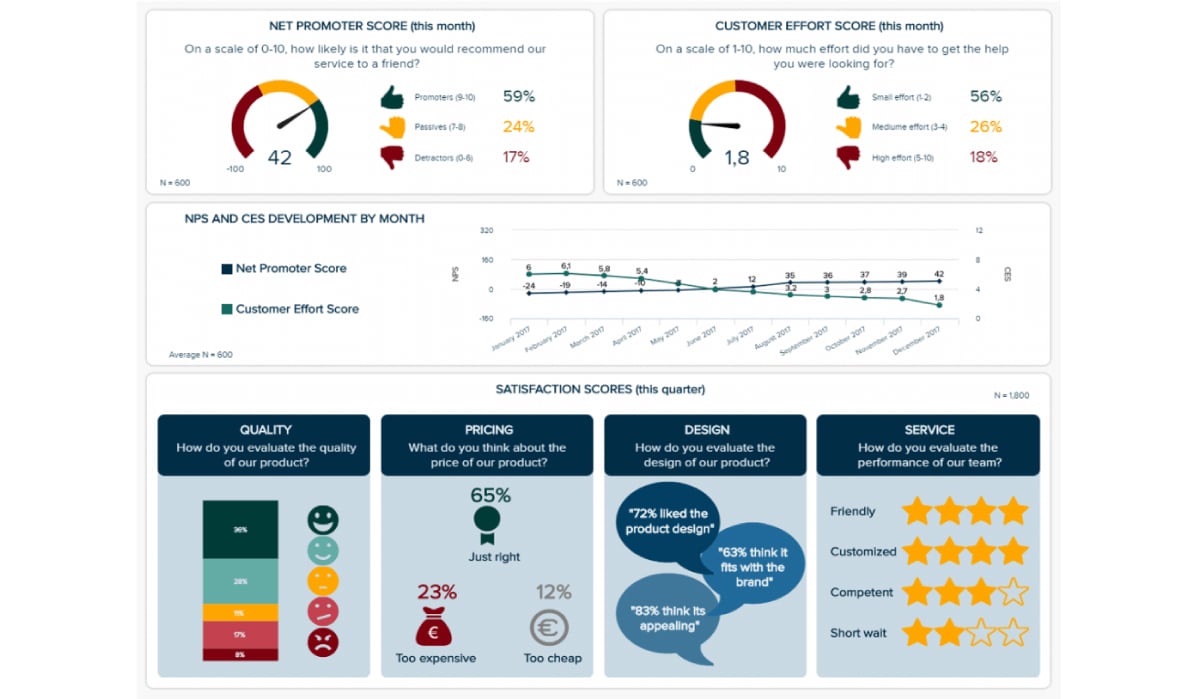
Market Research
Market research is one of the most marketable uses of quantitative data. Knowing how many people would like to purchase a product can provide significant insight into how a retailer should design their marketing strategies. Using potential customer profiles, market researchers create tools like customer journey maps to better understand customer behavior. To acquire the data necessary to construct these kinds of reports, many tools like surveys and polls are used to collect quantitative data from a target population.
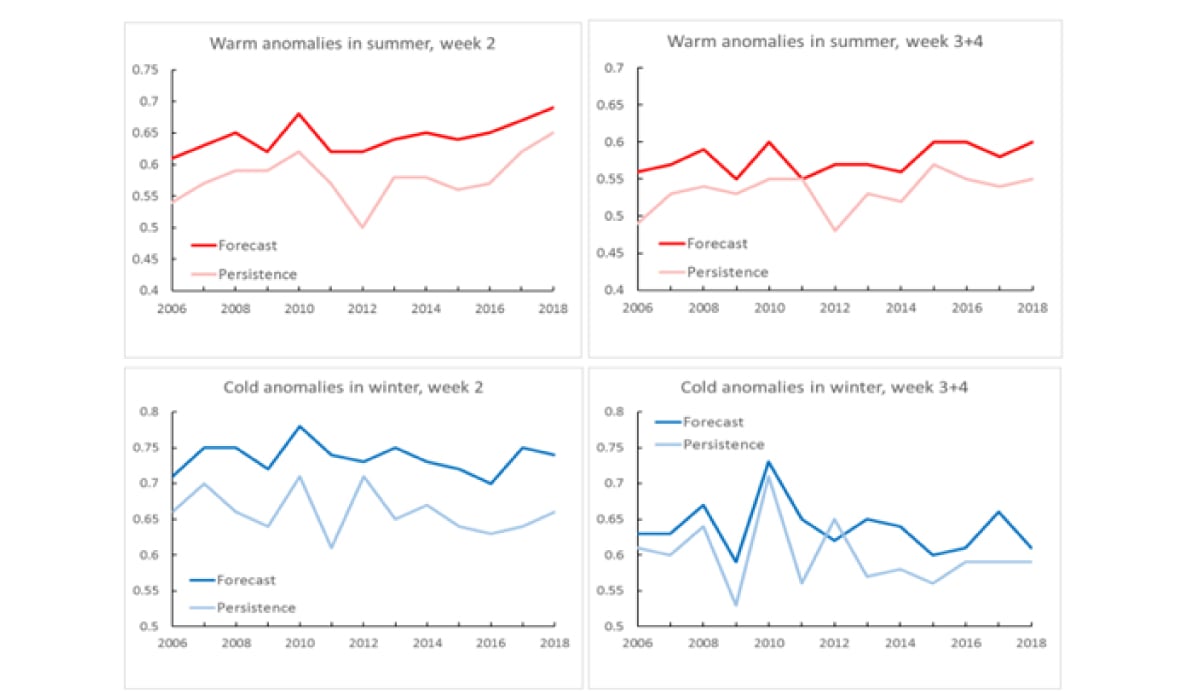
Weather Forecasting
Weather forecasting has evolved into a data-driven process. As methods have gotten more accurate, minute-by-minute updates can be provided to people in affected areas and save countless lives. Research centers monitor the changes in barometric pressures, wind speeds, and temperatures—each of these sources produces quantitative data that is used to make predictions and forecasts.
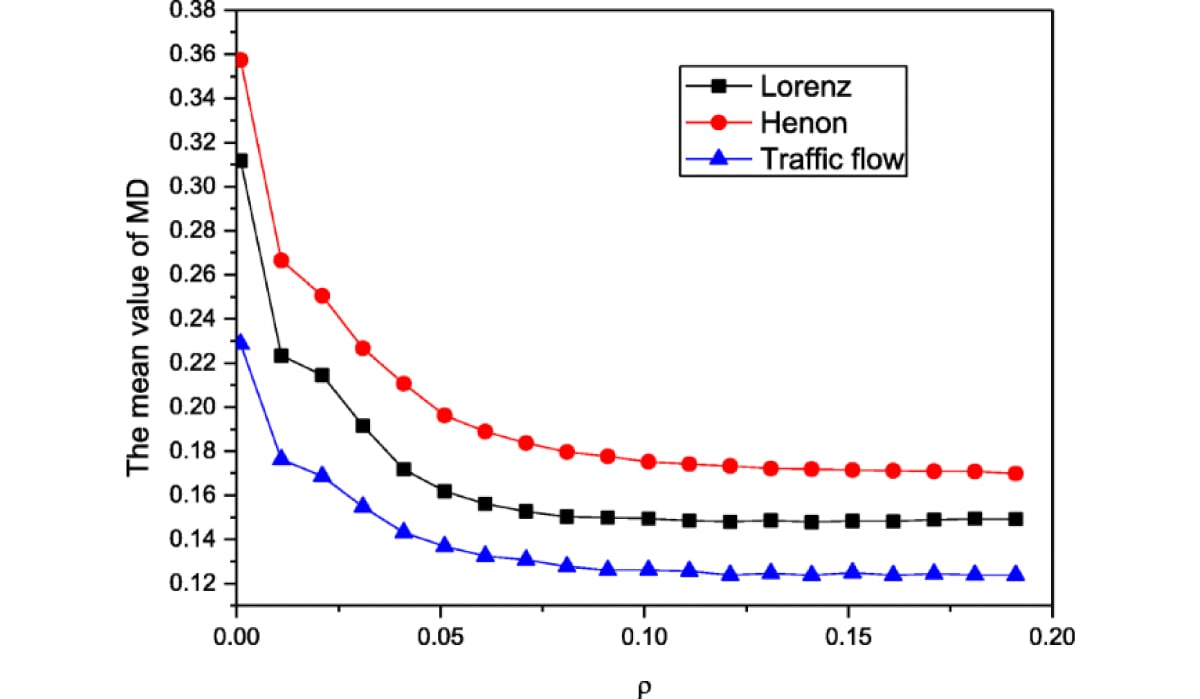
Traffic Engineering
As cities continue to expand, civil engineers are having to employ more sophisticated methods to maintain a consistent flow of traffic through urban environments using large amounts of quantitative data. Numbers of cars passing through an intersection, average speeds, numbers of accidents in a certain period of time—all of these metrics are examples of data that can be quantified to help engineers make predictions.
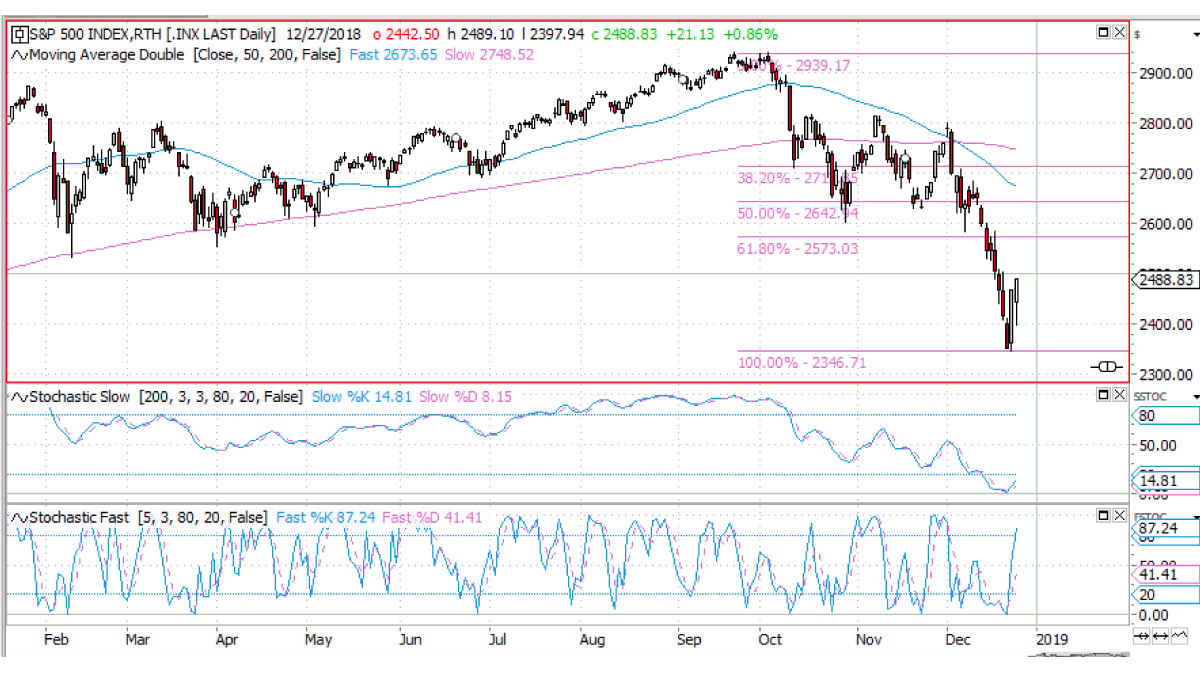
Stock Analysis
Stock indexes and market analysis all rely on quantitative data analysis. This analysis is used to make predictions about the stock market as a whole as well as individual stocks. Market indexes from around the world quantitative data that is reported by firms who analyze the markets using many data points. These data points they receive come from companies’ smaller sections of the market and quantitative models.
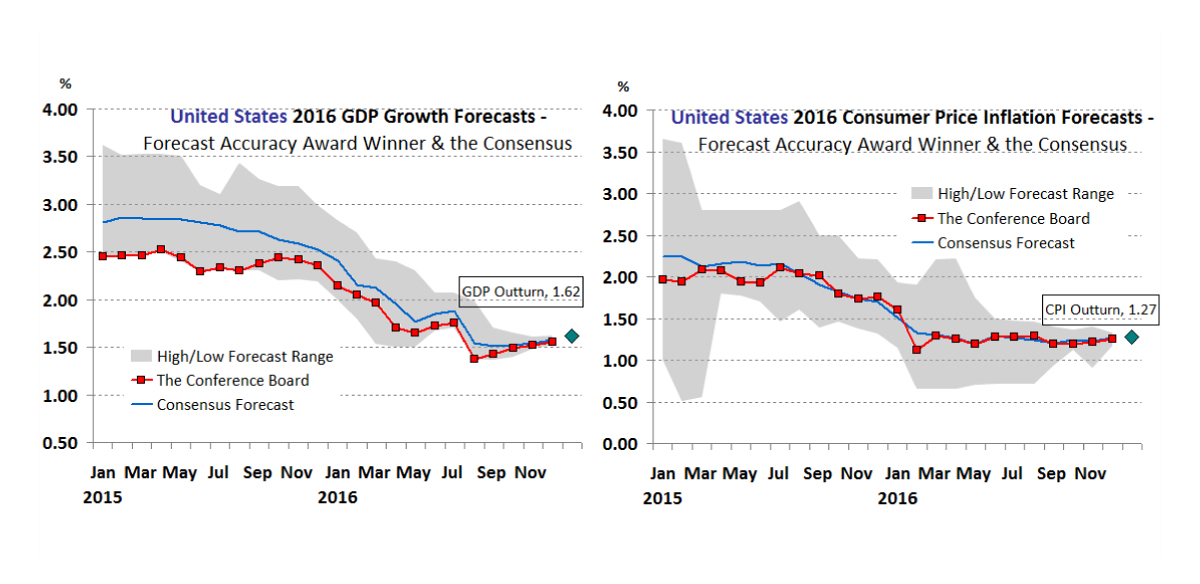
Economic Predictions
When economists make predictions, large amounts of data have undergone statistical analysis in order to make accurate forecasts. This can involve data sets that span years and sometimes decades worth of quantitative data, including prices of goods, gross domestic product (GDP) of a nation, or inflation rates,
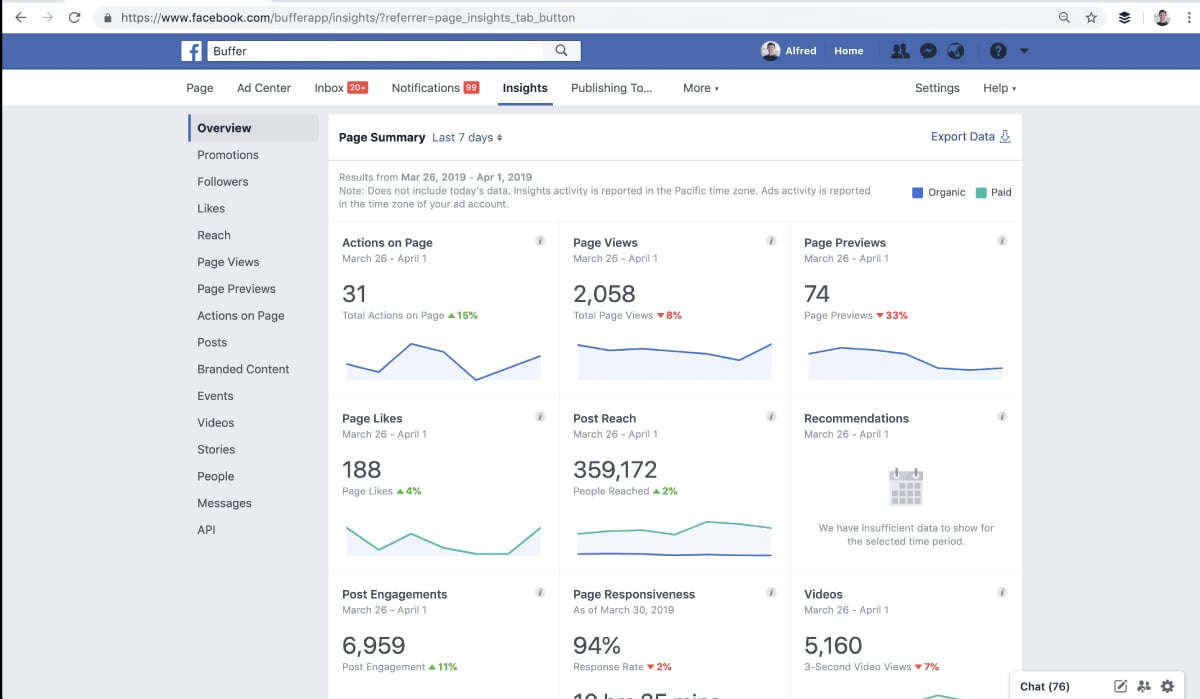
Social Media Analytics
One of the driving marketing tools in the digital economy is social media. When users consent to having their usage observed, they provide social media companies with quantitative data on their activities on those platforms. While there are many metrics that are involved in the process, the number of visitors to a website and a page’s bounce rate, the number of visitors that leave a site after only viewing one page, are two very significant pieces of data that are used to make content strategies.
What Is the Difference Between Quantitative Data and Qualitative Data?
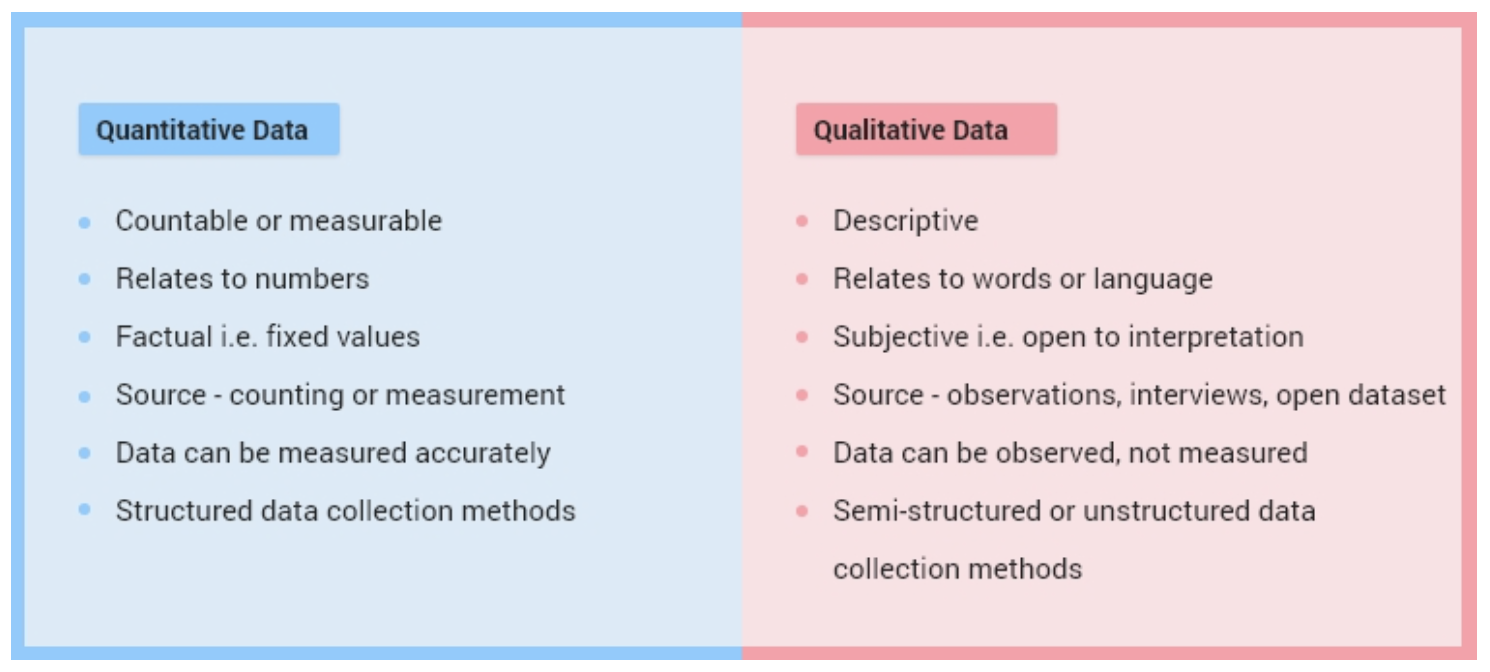
Data is separated into two categories: quantitative and qualitative. Each category covers a broad range of data types and differs in the type of information collected. While quantitative data is based on numerical information that is both objective and measurable, qualitative data is based on strictly non-numerical data.
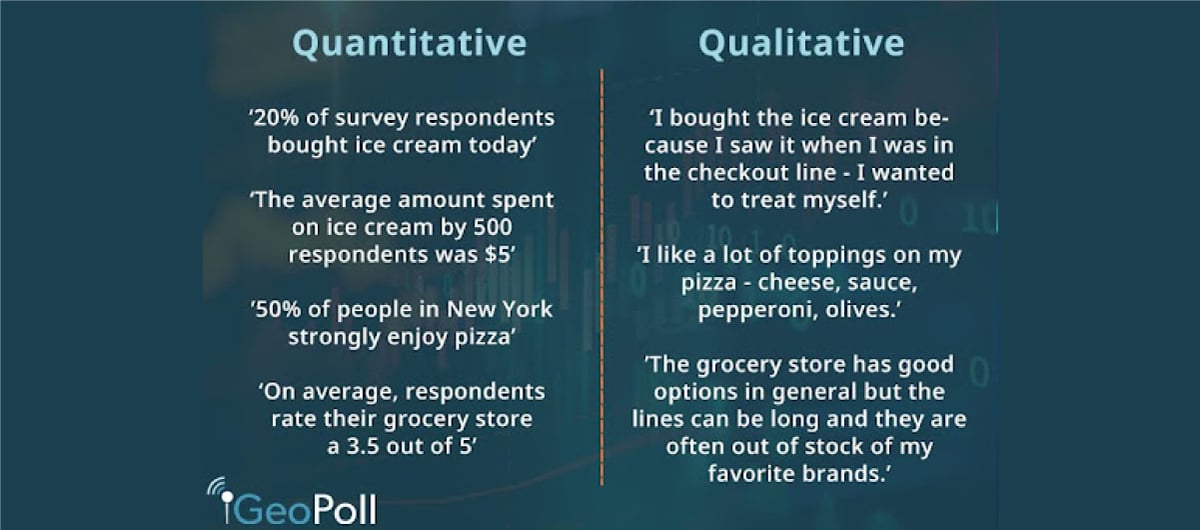
Numerical vs. Descriptive
An example of numerical versus descriptive data would be a graphic designer advising a brand on what color palette to use. The designer may conduct a survey and find that 50 more people clicked on an ad when it was one color than when it was another color. They might also say that one palette matches the brand’s image better because that color is known to generate a certain feeling with customers.
Measurable vs. Non-Measurable
Data can also be separated into measurable and non-measurable categories. Not every source of data can generate quantitative data. For example, many hospitals rate things like pain in a similar way by using a standardized pain scale. It would be non-measurable to have a patient say their pain is “bad” or “terrible.” Each person has a different interpretation of these words, making them difficult to measure. However, with the numerical pain scale, a patient can rate their pain on a scale from 0–10 based on a set description of 0 being no pain at all and 10 being the most severe pain that they have ever felt. Using this scale takes away the measurement bias in the data and makes it more measurable.
Objective vs. Subjective
Objective discoveries can often lead to subjective recommendations. For example, meteorologists use models that take numerical factors into account and make an objective judgment on where to expect a hurricane to pass. Using this objective data, the same meteorologists use subjective data to give advice to residents, like what kind of procedures to follow in cases of flooding or dangerous winds.
Data Collection Methods
Both qualitative and quantitative data types have similar ways of collecting data. It’s important to highlight the differences in how a survey may be designed to collect one type of data instead of the other. For example, a survey may ask 20 people to state how a flavor made them feel. This is an example of qualitative data. If the survey asks the same 20 people to select “Yes” or “No” on a form that asks them if they liked the flavor, it has now generated quantitative data. The difference is in both how information is collected and reported: 20 people with unique descriptions of a flavor versus a number of people out of the same population choosing one option or the other. One provides a variety of answers, while the other provides a count of people that selected an answer.
The Quantitative Data Collection and Analysis Process
The process of collecting and analyzing quantitative data must be conducted in a way that results in a data set that best represents the population that is being studied. Let’s break down what that looks like:
Data Collection
General Overview
Data collection methods for quantitative data involve many tools that differ depending on the industry. The most effective ways of collecting quantitative data remove possibilities for error from the equation.
Quantitative Data Collection Methods

Several methods exist for data collection. All methods require a lot of careful planning when being designed in order to avoid common method bias, an error where the method of data collection harms the quality of the data. An example of this bias could be asking the surveyed population an unclear question or a question that allows for answers that are outside of the scope of the study. Accurate measurements should be made, and the tools used in the process should only allow for the highest quality data to be generated.
- Surveys
Conducting surveys is one of the most common methods of collecting quantitative data. The surveys are constructed with a uniform set of questions that are asked to the entire population that is being studied.
- Controlled Observations
Oftentimes, studies need to be conducted in a controlled environment, one where the number of variables is lowered. This is where controlled observations are conducted. Usually conducted in labs, they are often used for studying behavior. Some of the most famous studies done on animal behavior were conducted in this same format.
- Sampling
When data is collected through sampling, it is done in a way that every member of the population has a chance of being selected. This requires researchers to select their population and collection methods wisely, as mistakes could result in an error due to a sampling bias.
- Secondary Data Collection
Secondary data collection is done with data sets that are already collected and compiled from primary sources. Often, researchers only need to search for data sets that already exist in order to find a set that meets their needs.
- Experiments
Experiments are the gold standard for the scientific world. While they are very similar to controlled observations, experiments introduce a treatment to the population that is being studied. This separates the population into a control group that receives no treatment and an experimental group that receives the treatment. One of the most common uses of this method is in drug trials.
Data Validation and Clean-Up

General Overview
For data analysis to be accurate, the data has to be validated as it is entered and cleaned to make sure that no errors occur while the analysis is being conducted. At this stage, a common issue that can arise is an estimate for measurement bias, where too many data points can be estimated, changing the final results significantly. As the information that is being analyzed will go on to make major business decisions, a standard of accuracy must be met.
Data Analysis
General Overview
After the data has been cleaned; the next step is to conduct thorough data analysis.
Types of Quantitative Analysis
The quantitative data, once analyzed, is used to make key data-driven business and customer decisions. This is divided into descriptive and inferential analysis.
- Descriptive Analysis
The process of describing the population or data set that is being analyzed is called descriptive analysis. No conclusions are made from this analysis.
- Inferential Analysis
Inference is the process of making assertions or predictions from the data that is being analyzed. This is accomplished by making conclusions from the data instead of simply describing it.
Quantitative Analysis Tools
There are many tools that have been developed to help analysts. Most are formatted in a similar way that allows analysts to directly enter data and carry out analytic functions within that software.
- SPSS (Statistical Package for the Social Sciences)
Developed by IBM, SPSS is a popular software suite for data analysis for businesses that utilizes a user-friendly interface.
- STATA
STATA is a statistical software that is used in a number of different data analysis processes.
- Excel
Excel is a staple of the data analysis process. Entry-level analysts can carry out operations that range from analysis to data visualization and presentation easily with the interface it provides.
- SAS
SAS is a software suite that provides a platform for data analysis. While similar to SPSS, SAS doesn’t require any additional programming knowledge.
FAQs About Quantitative Data
We’ve got the answers to your most frequently asked questions.
Is Quantitative Data More Reliable Than Qualitative Data?
Both types of data have their appropriate use. Accurate quantitative data is more reliable for the purposes of conducting inferential analysis and making predictions.
For example, a data scientist who is trying to help optimize the cost of production for a manufacturer will need quantitative data related to the production process, not qualitative data, in order to make an accurate and effective plan.
Why Is Quantitative Data More Accurate Than Qualitative Data?
Quantitative data is more accurate because it is based on measurable data that is less subjective than the data provided through qualitative methods. Descriptions of the same event may be different, depending on the observer.
However, with quantitative data, information is reported as numerical values, which are uniform and more universally understood than a description.
How Important Is Quantitative Data for Research?
Quantitative data provides the ability to make predictions. It is for this reason that it is a necessary component of most fields of research. The level of significance of a research study is also determined using quantitative data.
How Can You Tell if a Study Is Quantitative or Qualitative?
Quantitative studies rely on numerical data. Qualitative studies rely on accounts and personal descriptions of events.
Since you’re here…
Interested in a career in data analytics? You will be after scanning this data analytics salary guide. When you’re serious about getting a job, look into our 40-hour Intro to Data Analytics Course for total beginners, or our mentor-led Data Analytics Bootcamp.


![65 Excel Interview Questions for Data Analyst [2022 Prep Guide]](https://www.springboard.com/blog/wp-content/uploads/2022/06/interview-questions-for-data-analyst-.png)