
Free Data Analytics Course
Jumpstart your journey with 25 essential learning units in data analytics. No cost, just knowledge.
In 2006, renowned data scientist Clive Humbly famously declared data the new oil. Almost two decades later, this metaphor remains true. Like data, oil is a highly valuable and coveted resource. But oil also requires refinement—you can’t put crude oil, freshly extracted from the ground, straight into your car.
Likewise, data needs to be refined before it can be used effectively. To do this, data analysts use various methods to collect, extract, and refine raw data. Below, we’ll detail 12 of the most useful methods that you can use on your next data science project.
What Is Data Analysis?
Data analysis is the process by which raw data is converted into information that is both relevant and actionable. That information is extremely valuable to businesses because it allows them to make informed decisions based on empirical data and statistical analysis.
12 Data Analysis Methods
The data analysis process isn’t a single technique or step. Rather, it employs several different methods to collect, process, and the data to deduce insights and actionable information.
Here are the 12 most useful data analysis methods:
Regression Analysis

General Overview
This method of analysis is used to understand the relationship between dependent variables and independent variables. A dependent (or “main”) variable is the thing you want to understand (e.g., in-store sales figures). Independent variables are the factors that might be impacting your dependent variable (e.g., the weather).
How Does It Work?
By plotting the different set points of the variables to a graph, you will be able to determine, with a higher degree of certainty, what the relationship is between your variables.
Example
Say you plotted the daily sales figures of your business on the y-axis of your graph. On the x-axis, you plotted the amount of rain that fell on the corresponding days. Looking at the data points, you could, with some certainty, predict how the rain (your independent variable) impacts sales (your dependent variable).
Dispersion Analysis
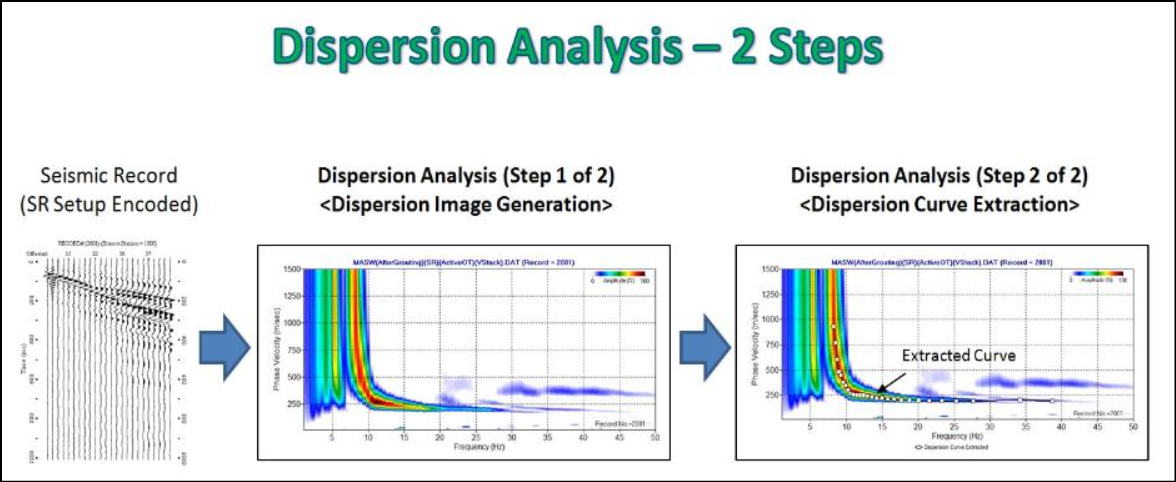
General Overview
This diagnostic method is used to determine how dispersed or stretched your data set is. Measuring dispersion establishes the variation between items, which can help determine the reliability and relevance of your data.
How Does It Work?
The first step in performing dispersion analysis is to measure the variation among the data points themselves. Next, take the value of that variation and compare it to the standard deviation of the entire dataset. If the difference between the value of the variation and the average deviation is high (i.e., if your data is stretched), then the dispersion is high.
Example
Investors often use dispersion analysis to assess the risk of an investment. By looking at the dispersion of returns on a certain investment, investors can gauge its risk. Say you’re looking at a stock that has high dispersion. In other words, its range of possible outcomes (returns) is far apart. One month its growth was 5x the market average; in a different month, its losses were 5x as severe. From this dispersion, you would infer that this is a volatile stock and investing in it is a high-risk proposition.
Artificial Neural Network Analysis
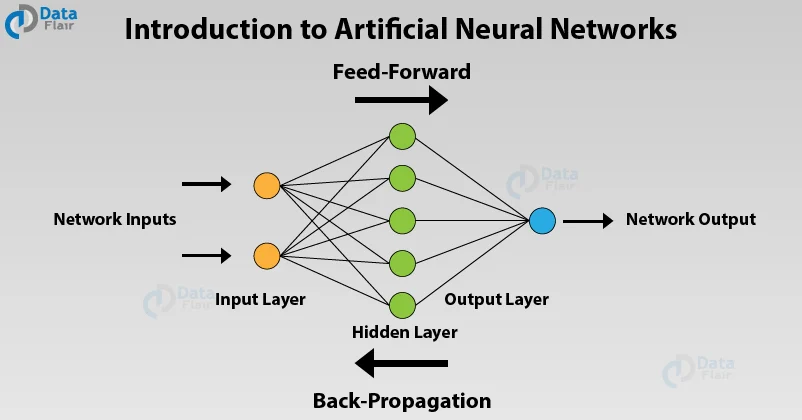
General Overview
Artificial neural network analysis uses machine learning to analyze data and make inferences similar to how a human brain might. As more data is introduced, the better neural networks become at recognizing patterns and discovering trends.
Related Read: These Machine Learning Startups Are Ushering in a Data Revolution
How Does It Work?
Artificial neural network analysis works by introducing data into the network in order to train it how to make predictions—it’s similar to how the human brain works. These predictions are tested for accuracy and then refined. As more data is introduced, the network continues to “learn” and update its predictions.
Example
Neural networks are frequently used in the finance sector to forecast market outcomes over time, analyze transactions, assess risk, and more.
Grounded Theory Analysis

General Overview
Grounded theory is a qualitative data analysis method that takes an inductive approach to research. Unlike conventional research methods that use confirmatory analysis to establish a hypothesis before data collection, grounded research focuses on developing theories based on the collected data.
How Does It Work?
In practice, grounded theory employs a systematic set of procedures for data collection, analysis, and theory development that, while strict, help mitigate confirmation bias and ensure sound analysis. These procedures must be explicitly followed for the research to remain “grounded.”
Example
An example of grounded theory analysis would be a human resources department conducting research on low employee morale. Following the specific set of procedures required for grounded analysis, researchers would collect data (e.g., conduct interviews, observe behaviors, etc.), then analyze the results to determine the underlying cause of the low morale.
Cluster Analysis

General Overview
Cluster analysis is used to identify the different structures in your data set.
How Does It Work?
Using this technique, analysts collect similar data points from a given set of data and put those points into a group, or cluster. Analysts can then look for patterns within those clusters in order to glean insights and predict future behaviors.
Example
In marketing, cluster analysis is used to sort a large and eclectic customer base into smaller groups of shoppers with similar demographics. This is how we get targeted advertising.
Cohort Analysis

General Overview
Cohort analysis evaluates the data gathered from groups of subjects who share one or more common characteristics during a specific time period. These groups are referred to as cohorts.
How Does It Work?
Cohort analysis works by first establishing your group or cohort, then tracking the behavior of that cohort over time to look for patterns of behavior and gain insight into future behavior.
Example
An example of cohort analysis would be if your company offered a $100 instant rebate to customers who buy a specific product through your online store. Customers who purchase the product and claim their instant rebate are your cohort. For the next 12 months, you track the purchasing behavior of those customers to see if any patterns arise. Do they instantly spend their rebate? Do they buy accessories related to the original product they purchased? What percentage of the cohort participates in other instant rebate promotions? Analyzing the behavior of your cohort gives you a better understanding of their shopping patterns and allows you to predict what their future behavior might be.
Get To Know Other Data Analytics Students

Joel Antolijao
Data Analyst at FanDuel

Reagan Tatsch
Data Operations Manager at ISS

Cleo Valencia
Student In The Data Analytics Bootcamp at Springboard
Factor Analysis

General Overview
Factor analysis is a specific type of regression analysis used to reduce a large set of variables into smaller, more manageable groups of factors.
How Does It Work?
A factor analysis looks for latent correlations between variables. Once these correlations are discovered and brought forward, individual variables can be grouped into factors that belong together. In other words, instead of having 100 different variables, you can use factor analysis to group some of those variables into factors, thus reducing the total number of variables.
Example
An example of factor analysis could be an employee satisfaction survey sent out to 100 people in your office. The surveys are comprehensive, and what you get back is an enormous dataset that tells you hundreds of different things about every person who took the survey. Instead of trying to analyze each survey, you can use factor analysis to group the surveys into manageable groups. For example, you might discover a strong correlation between salaried employees and employees who contribute to the max amount to their 401K—these variables can be grouped.
Text Analysis

General Overview
Text analysis, or sentiment analysis, is a qualitative data analysis method that searches for trends and patterns in textual data to better understand how customers feel.
How Does It Work?
Text analysis uses an array of algorithms trained to associate certain words with certain thoughts, feelings, or opinions. This information is used to deduce how customers feel about a particular thing.
Example
For example, if someone inputted the textual data “boring” to describe a newly released film, that data would be tagged as expressing a negative sentiment.
Time Series Analysis

General Overview
Time series analysis is a method of statistical analysis used to forecast patterns over time.
How Does It Work?
By measuring the same, specific variable at different points in time, data analysts can pick out trends and patterns that allow them to make informed predictions about future events.
Example
A simple example of time series analysis is if you noticed a surge in stocking cap sales during the month of November every year. Using time series analysis, you could predict that this November stocking cap sales would be high.
Monte Carlo Simulation

General Overview
A Monte Carlo simulation is a predictive method of data analysis that forecasts what the likelihood of a range of outcomes might be of an uncertain event or variable.
How Does It Work?
A Monte Carlo Simulation begins by first assigning the variable in question a random value that falls within the possible distribution of outcomes. Once that value is provided, the model is run again, and the result is provided. This process repeats over and over. Each time, the uncertain variable is assigned a random number, and the result is recorded. Once the simulation is complete, the likelihood of all possible outcomes will be provided.
Example
An example of a Monte Carlo Simulation is if you were trying to calculate the likelihood of rolling a particular value using a standard set of dice. The simulation would assign random values between 1 and 6 to each die, then record the sum. The process would repeat, each time using random values between 1 and 6 for each die. After enough iterations, the simulation will yield the range of all possible outcomes (i.e., the sum of all possible rolls) and the likelihood of each.
Discourse Analysis

General Overview
Discourse analysis is a qualitative data analysis method that attempts to understand the world by analyzing how people use language.
How Does It Work?
There are multiple approaches and techniques available to conduct discourse analysis. Regardless of which method of discourse analysis you choose, the general outline follows these steps:
- Define your objective: What do you want to know?
- Establish context: Gather factual data that provides a deeper understanding and context about the discourse you’re analyzing. Take care to ensure the integrity of the data you’ve collected and be certain it’s free from confirmation bias.
- Content analysis: Analyze the data you’ve gathered for patterns in language and usage that relate to your objective.
- Develop theory: Review your results and, based on your analysis of the language used, begin developing a theory that answers your objective.
Example
One example of discourse analysis would be if you wanted to know whether your colleagues were more forthcoming about their personal lives outside of work. After establishing context, you could observe how they spoke to each other and the topics they discussed in the company cafeteria versus outside the office in a social situation.
Evolutionary Programming

General Overview
Evolutionary programming is a computerized method of stochastic optimization that can be used to forecast predictions.
How Does It Work?
Data scientists apply the same population-based variation and selection model originally created for evolutionary programming to real-world data structures and optimization problems. These problems include everything from traffic planning to predicting how likely someone is to default on their mortgage.
Example
Evolutionary algorithms are often used in data mining to generate predictive rules derived from datasets.
How Can You Determine the Appropriate Data Analysis Method for Your Needs?

Consider the following to pick the right data analysis method:
Objective
The first step in determining which data analysis is the most appropriate for your needs is to clearly define your objective. In other words, what problem are you trying to solve? A clearly defined objective can also help curb confirmation bias, provided the ensuing analysis is conducted in an equally honest manner.
Type of Data
Once you have defined your objective, you will have a better idea of what type of data you need to collect. The two data types are:
- Quantitative Data: Data containing specific numbers and quantities that can be counted or measured. Examples of the quantitative data analysis method include regression analysis, cohort analysis, factor analysis, etc.
- Qualitative Data: Descriptive data that can be seen but not measured objectively. Examples of the qualitative data analysis method include text analysis and discourse analysis.
Data Complexity
The complexity of the data you need to collect plays an important role in determining the appropriate data analysis method. Data that is too complex for conventional analysis methods is called “big data.” Effective big data analysis can only be achieved through specific advanced analysis methods (e.g., regression analysis, text analysis, etc.).
Duration Available
How long you have to conduct your analysis is another important factor to consider. If your window for analysis is relatively small, for example, you might avoid time series analysis, as a shortened sampling duration might not yield valuable insights.
Other Factors
Other factors to consider when determining the appropriate analysis method include the quality and relevancy of the available data. Make sure that the data you’re using is clean and free of unnecessary noise that might compromise its integrity. Likewise, make sure your data is relevant to the objective at hand and can be properly analyzed using your chosen method of analysis.
What Biases Should You Avoid in the Data Analysis Process?

Biases of all kinds can skew your findings. Here are some of the most common biases to avoid:
Selection Bias
Selection bias occurs when your data comes from sources that do not accurately represent the target population or demographic. It can be the result of sampling data from too small a group or if the sampling process is not randomized. Cohort analysis, in particular, is susceptible to selection bias.
Omitted Variables
Omitted variable bias occurs when a relevant variable is left out of a model resulting in biased and inconsistent estimates.
Cognitive Bias
Cognitive biases are subconscious thoughts that do not comply with basic principles of logic, probability, or reasoning. These biases cause systematic errors in interpretation and judgment and are the basis of subsequent behavior. Examples of cognitive bias include confirmation bias, attentional bias, false consensus effect, etc.
Automation Bias
The belief that computers are more objective, and therefore more trustworthy, than humans is what causes automation bias.
FAQs About Data Analysis Methods
We’ve got the answers to your most frequently asked questions.
How Do I Know if My Data Analysis Is Correct?
To ensure your data analysis is correct, first, be certain that your data is clean. After all, garbage in, garbage out. In other words, bad data yield bad data analysis.
Ensuring the integrity of your data should be done during the initial data analysis phase when the focus is on the quality of your data and data collectors. Exercising these best practices during the initial data analysis phase will help ensure your main data analysis is correct:
Remain vigilant and meticulous. Look for data outliers, omitted variables, and other errors. Check and recheck the numbers. One mistake can compromise the validity of your entire analysis.
Validate the authenticity of data using multiple sources. The more sources you have for a piece of data, the more reliable it becomes, and the less likely it is to compromise your analysis. Conversely, if you have one source of data, and that source is wrong, then your analysis could become compromised because it is based on false data.
Interview and cross-examine data collectors to ensure the quality, consistency, and manner of the data collection process. Data collectors can influence the person they are interviewing, possibly skewing the veracity of their comments. Make sure that data collectors adhere to their script, refrain from confirmation bias, and maintain objectivity throughout the interview.
Is One Data Analysis Method Better Than Another?
Each data analysis method comes with its own set of advantages and disadvantages. Determining which method is the right approach for you depends on multiple factors, including the type of data you need to collect.
Begin by identifying the objective of your analysis: What problem are you trying to solve with your analysis? Based on your objective, you should be able to determine the type of data you need, and whether that data can be more readily obtained and analyzed through quantitative data analysis methods or qualitative data analysis methods.
Since you’re here…
Considering a career in data analytics? We can get you there. Don’t take our word for it – check out our student reviews. After just 6 months of study in our fully flexible Data Analytics Bootcamp, we’ll boost you into a job in the field or your tuition back. Get started now with our free data analytics course.